
Did you know… (Rankings)
Welcome to our series on helpful tips for PolicyMap. With over 4,000 indicators of data and many features, we hope our series can help users better utilize PolicyMap. For a complete training, please join a free online session here: Click Here
Did you know subscribers can see where a geography ranks in a dataset on PolicyMap. Want to see how your state ranks in the nation? Or your city? Or even your census tract? Rankings will let you see how your location compares and also show the top 10 and bottom 10 locations in that dataset.
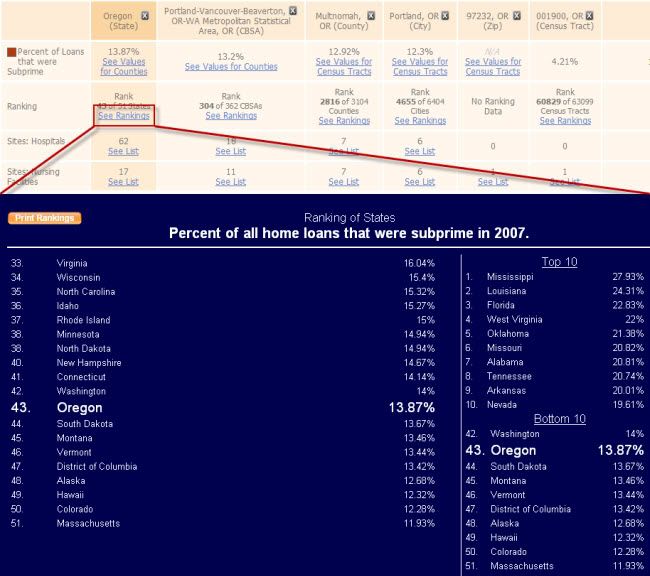
Rankings are available on the Tables page and there are two ways to access:
- Select the Tables button on the top left. This step requires you to add location(s) and a data layer.
- With a data layer loaded from the Maps page, open the identifier bubble and select See Table. This step will pull all the geographies in the ID bubble and will display rankings for each location.

Read our Quick Start Guide to learn the basics of PolicyMap and jump right into using the power of data.
If you wanted to know more about a feature or topic, send your request toinfo@policymap.com subject “Did you Know…”
Sincerely,
The PolicyMap Team
![]()