
FEMA Flood Maps on PolicyMap
FEMA flood maps, formally known as the National Flood Hazard Layer (NFHL), display the risks of flood hazards across the country. They inform the types of flood insurance needed, as well as the legality and wisdom of building in certain flood-prone areas.
They come in a complex assortment of technical codes, like A, A99, AE, AH, AO, V, VE, X (shaded), and X (unshaded). Each designates a certain level and type of risk, the specifics of which are important in the insurance realm.
PolicyMap has taken these maps and made them available to subscribers in an easy-to-understand and easy-to-use format.
Unlike most of our data, these overlays are in the “Map Boundaries” menu below the map. This means that you can load a point or layer dataset, and then overlay the flood map on top of that.
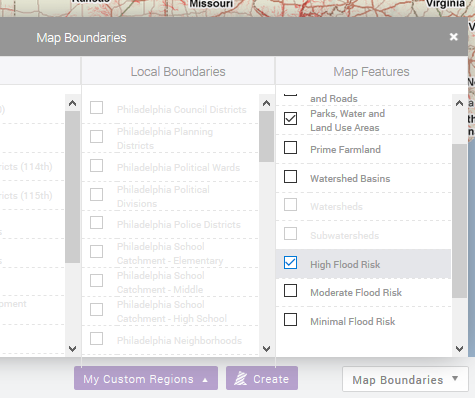
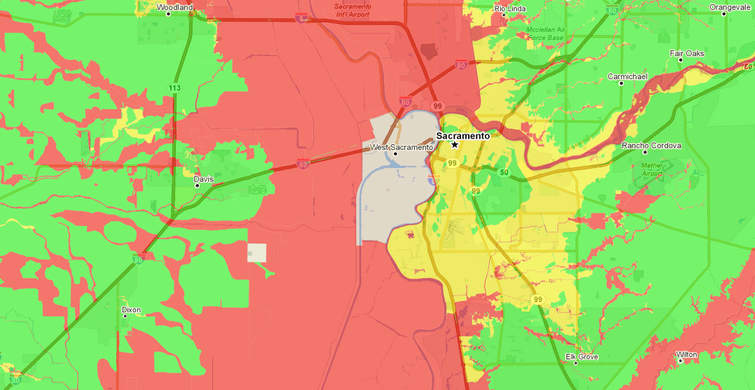
The layers are divided into three categories: low, moderate, and high flood risk. This is a simplification of FEMA’s complex assortment of flood map categories:
- High risk: 1 percent chance of being inundated in a given year (known as a 100-year flood)
- Moderate risk: .2 percent annual chance (500-year flood)
- Low risk: less than a .2 percent annual chance
For you flood map nerds, high risk flood zones include flood zones categorized as A, A99, AE, AH, AO, V, and VE; moderate risk includes X (shaded); low risk includes X (unshaded).
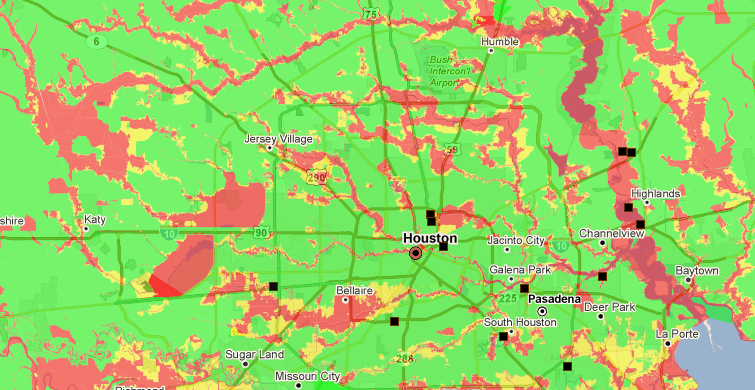
You can make some interesting observations using this data, such finding where toxic Superfund sites are in high-risk areas.
Keep in mind, FEMA is constantly revising these flood maps, and our maps are refreshed every December. Not all areas of the country have flood maps, so an area not showing any category of flood zone is not necessarily free of flood risk. Check out FEMA’s Flood Map Service Center for more information, as well as the latest flood maps with the specific flood zone categories.
Even though they’re new for our subscribers, we’ve been working with FEMA flood maps for years, and know a lot about them. They present a lot of challenges.
They’re very large files. When we first started processing them, FEMA required us to mail them a blank hard drive, which they loaded with the flood maps, and mailed back to us. For years after that, they would send us spindles of DVDs containing the data for each state. Recently, they became available for download, though the amount of data available has increased further.
We first processed these back in 2010, which was my first year working at PolicyMap. While copying the files from the hard drive to our file server, I managed to crash the entire office’s file server. Twice in one day. It’s one of my proudest moments.
Even though we’ve been working with this data for a while, we couldn’t display them on our main site until now due to technical limitations. The maps are so detailed and extensive that they caused our site to overload. We’ve gotten over those technical hurdles, and they’re now available.
Due to its complexity and the work done to make it comprehensible, this data is available to subscribers only. If you’re not a subscriber, you can sign up for a free trial here.