
Why Are There So Many New Power Plants?
Data
Electric Generating Plants
Source
EIA
Find on PolicyMap
- Economy
- Infrastructure
- Energy
- Electric Generating Plants
- Infrastructure
When we recently updated our data on power plants and electricity generation, both from the U.S. Energy Information Administration, we noticed something interesting: about 1,100 new power plants popped up during the year and a half since the data was last released, a nearly 13 percent increase. Why the big jump?
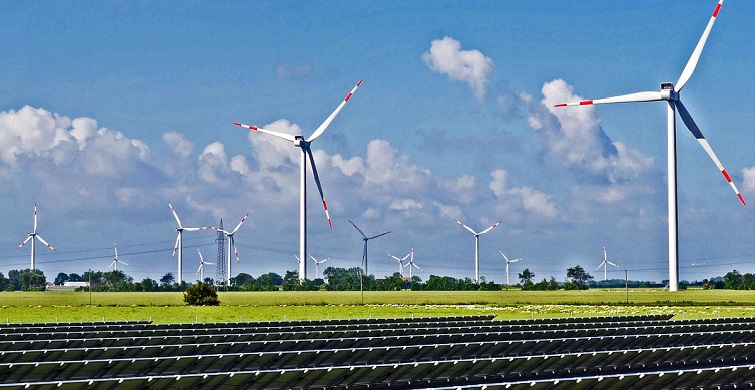
A Renewable Energy Boom
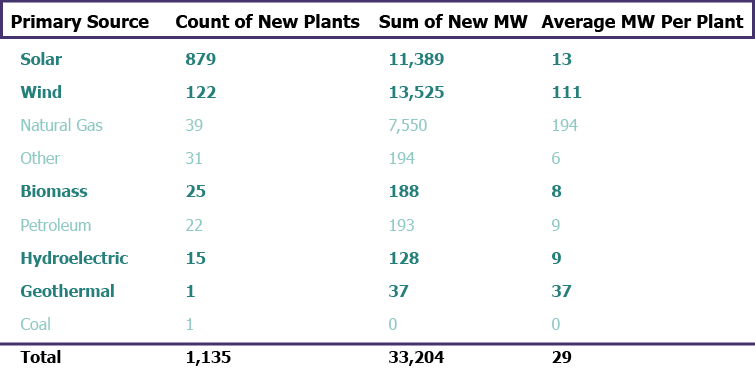
Looking at just the new power plants—those 1,135 that were built since the last data update—all but 93 of them are renewable energy plants. 879 are solar and 122 are wind. Most of the new non-renewable energy plants use natural gas. There’s a single new coal plant, but for now, it’s not producing any electricity.
Though renewable energy plants comprise the vast majority of new plants, they generally produce less electricity per plant than new natural gas plants. The average maximum capacity of all plants in the country is 125 megawatts (MW); the new solar and wind plants average 13 MW and 111 MW, respectively. The solar revolution is likely taking place on smaller-scale fields instead of industrial solar farms.
Why are these new plants located where they are?
Where are these new plants? They’re spread throughout the country, with the majority located in California, Minnesota, Massachusetts, New Jersey, and North Carolina.
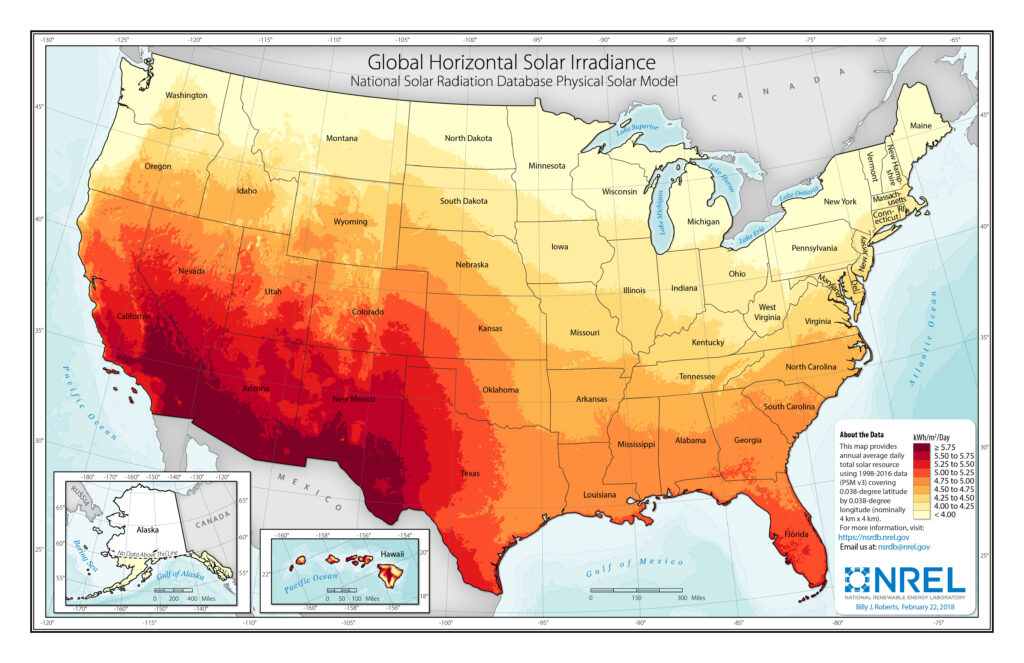
What about the solar plants? They are generally located along the east coast, with several additional states home to large concentrations. However, only three of the top ten states for solar plants—California, Colorado, and Texas—are also high recipients of solar radiation, meaning many states that would be great candidates for new solar plants aren’t harnessing the energy they could be.
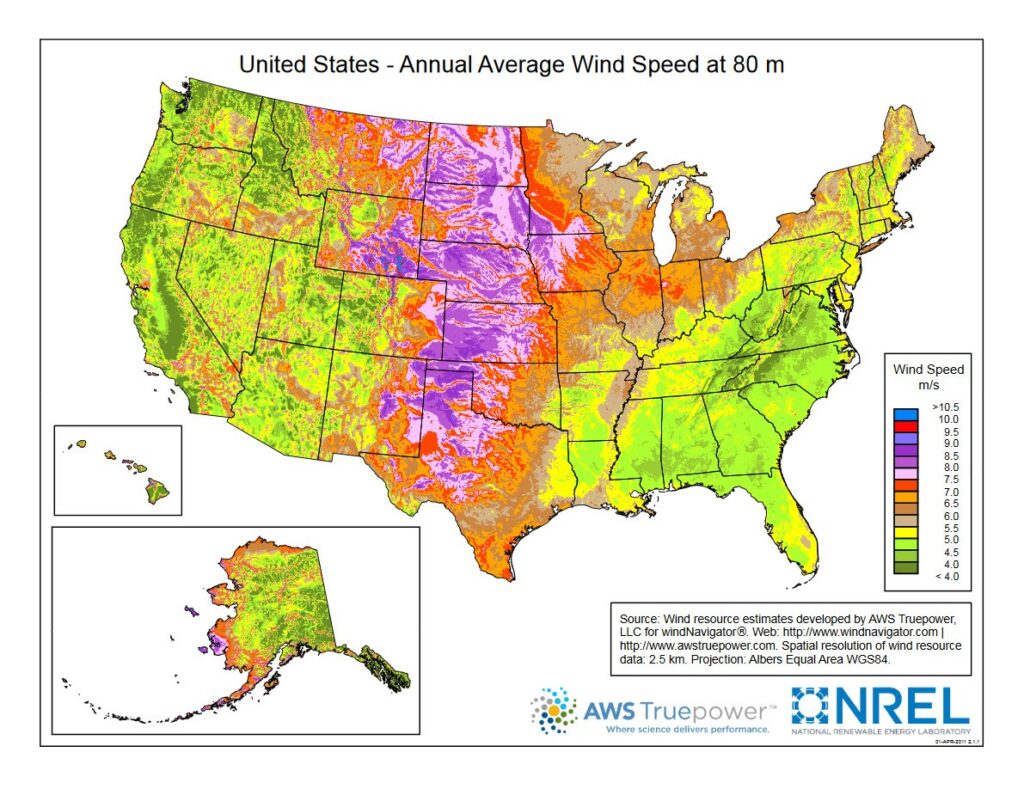
Are new wind plants, whose total energy output exceeds the new solar plants, better positioned? States located along the Great Plains typically receive the most wind, shown by the vertical swath of purple and red in the center of the map below. Six of the top ten states with new wind plants are located along this stretch, including Texas, Iowa, and Oklahoma—which, together, account for 40 percent of the new plants.
What about the other states, though: the northwestern ones with new solar plants, or the coastal ones with new wind plants? There must be a different reason why those states are investing so much in renewable energy.
Legislative Power
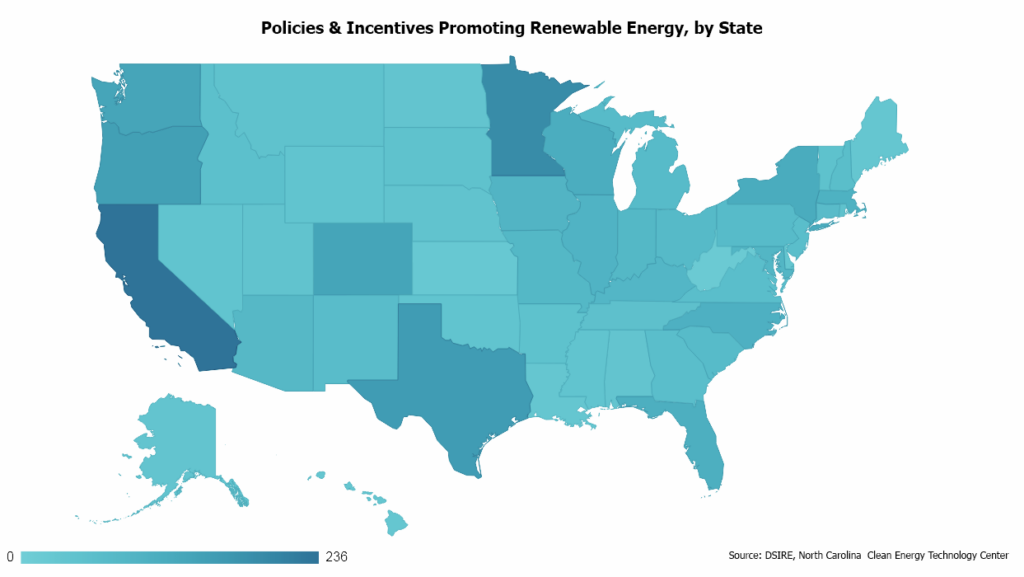
This map from the Database of State Incentives for Renewables & Efficiency shows how many policies and incentives different states have to encourage development of renewable energy resources. Some states, like California and Texas, have policies that encourage development to take advantage of these abundant resources. Other states, like Minnesota and North Carolina, are encouraging renewable energy growth despite less abundant resources. North Carolina has over a hundred policies and incentives promoting renewable energy, leading to 171 new renewable plants in the past year.
Both tactics make sense: States with wind and sunlight encourage using those resources. Other states do have wind and sunlight, but need extra incentives to encourage going green. The policy questions are: What states have abundant renewable resources but aren’t taking enough advantage? And are there states where renewable energy is economical enough that incentives are no longer needed? This data might suggest that a federal policy would help encourage renewable energy plants in states with the most resources, but with the current administration reducing renewable energy incentives, it looks like it’s going to be up to individual states to advance green energy.