
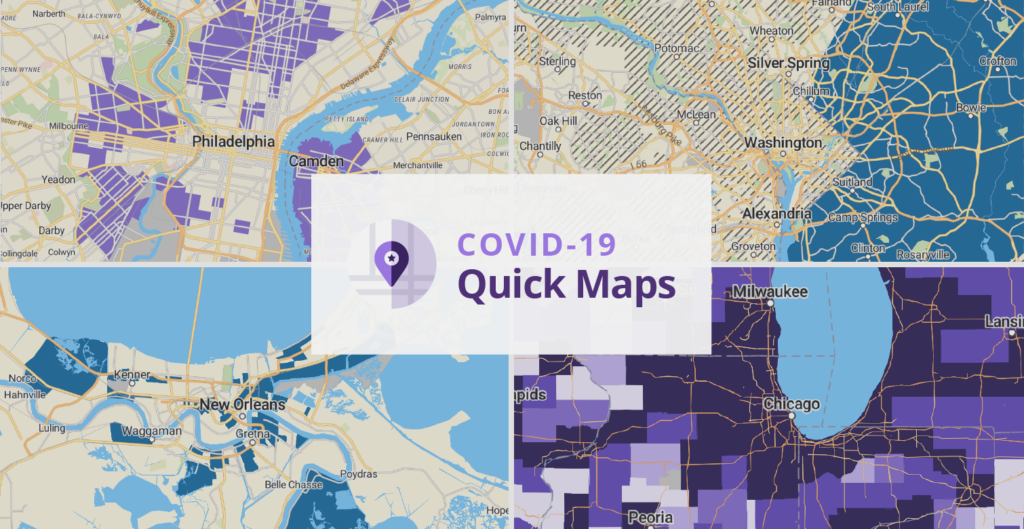
Introducing PolicyMap COVID-19 Quick Maps
Maps can help us do more than track the spread of the virus.
Maps can provide us with the insights needed to create data-driven strategic interventions in communities across the United States. They allow us to identify where vulnerable populations live, hospitals that might be at risk of a surge in cases, neighborhoods without access to telehealth services or disproportionately impacted populations. Maps with data from disparate sources in a single application can illuminate answers to these issues.
Today, we are releasing a single, publicly available (beta) application focused on answering crucial questions faced by communities dealing with the impact of the COVID-19 virus. We’re calling it PolicyMap COVID-19 Quick Maps.
Our mission, since we launched PolicyMap in 2008, has been to curate, normalize, and make available disparate geographic data from across siloed agencies and private sector entities in a single, easy-to-use, application so that policymakers and others can more easily make data-driven decisions.
Now, with the current crisis gripping the US, data needs a place at the table more than ever.
Data in PolicyMap COVID-19 Quick Maps includes:
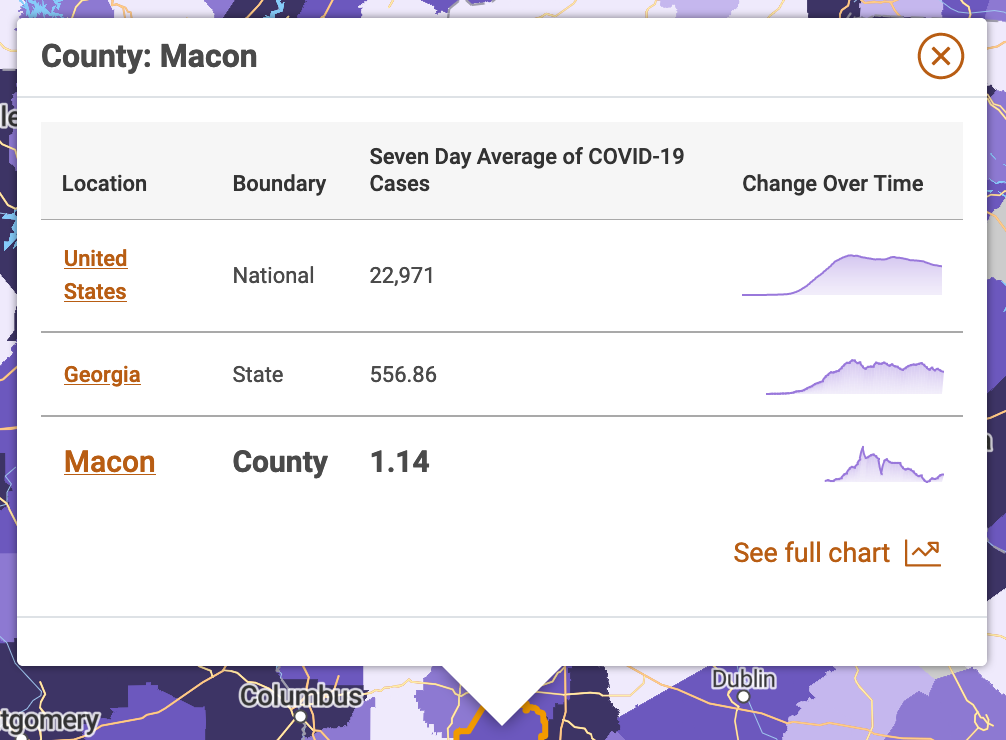
- Severe COVID-19 Health Risk Index, created by PolicyMap for the New York Times.
- COVID-19 Daily Cases and Deaths (counts, rates and weekly averages) as reported by the New York Times.
- COVID-19 Testing Rates as reported by the COVID Tracking Project
- Social Vulnerability from the Centers for Disease Control. This includes an overall index created by the CDC, as well as the underlying four categories of indicators used by the CDC in the creation of this index: socioeconomic status, household composition and disability status, minority status and language and, housing and transportation.
- Underlying Health Conditions, such as asthma and COPD, as estimated by PolicyMap using CDC’s Behavioral Risk Factor Surveillance System.
- Basic demographics including age, race and incomes from the Census’ American Community Survey.
- Homeless Population counts from the Department of Housing and Urban Development.
- Computer and Internet Access from the Census’ American Community Survey.
- ICU Beds as reported by Kaiser Health News.
- Hospital Capacity and Federally Qualified Health Centers from the Health Resources and Services Administration.
- Insured and Uninsured Populations from the Census’ American Community Survey.
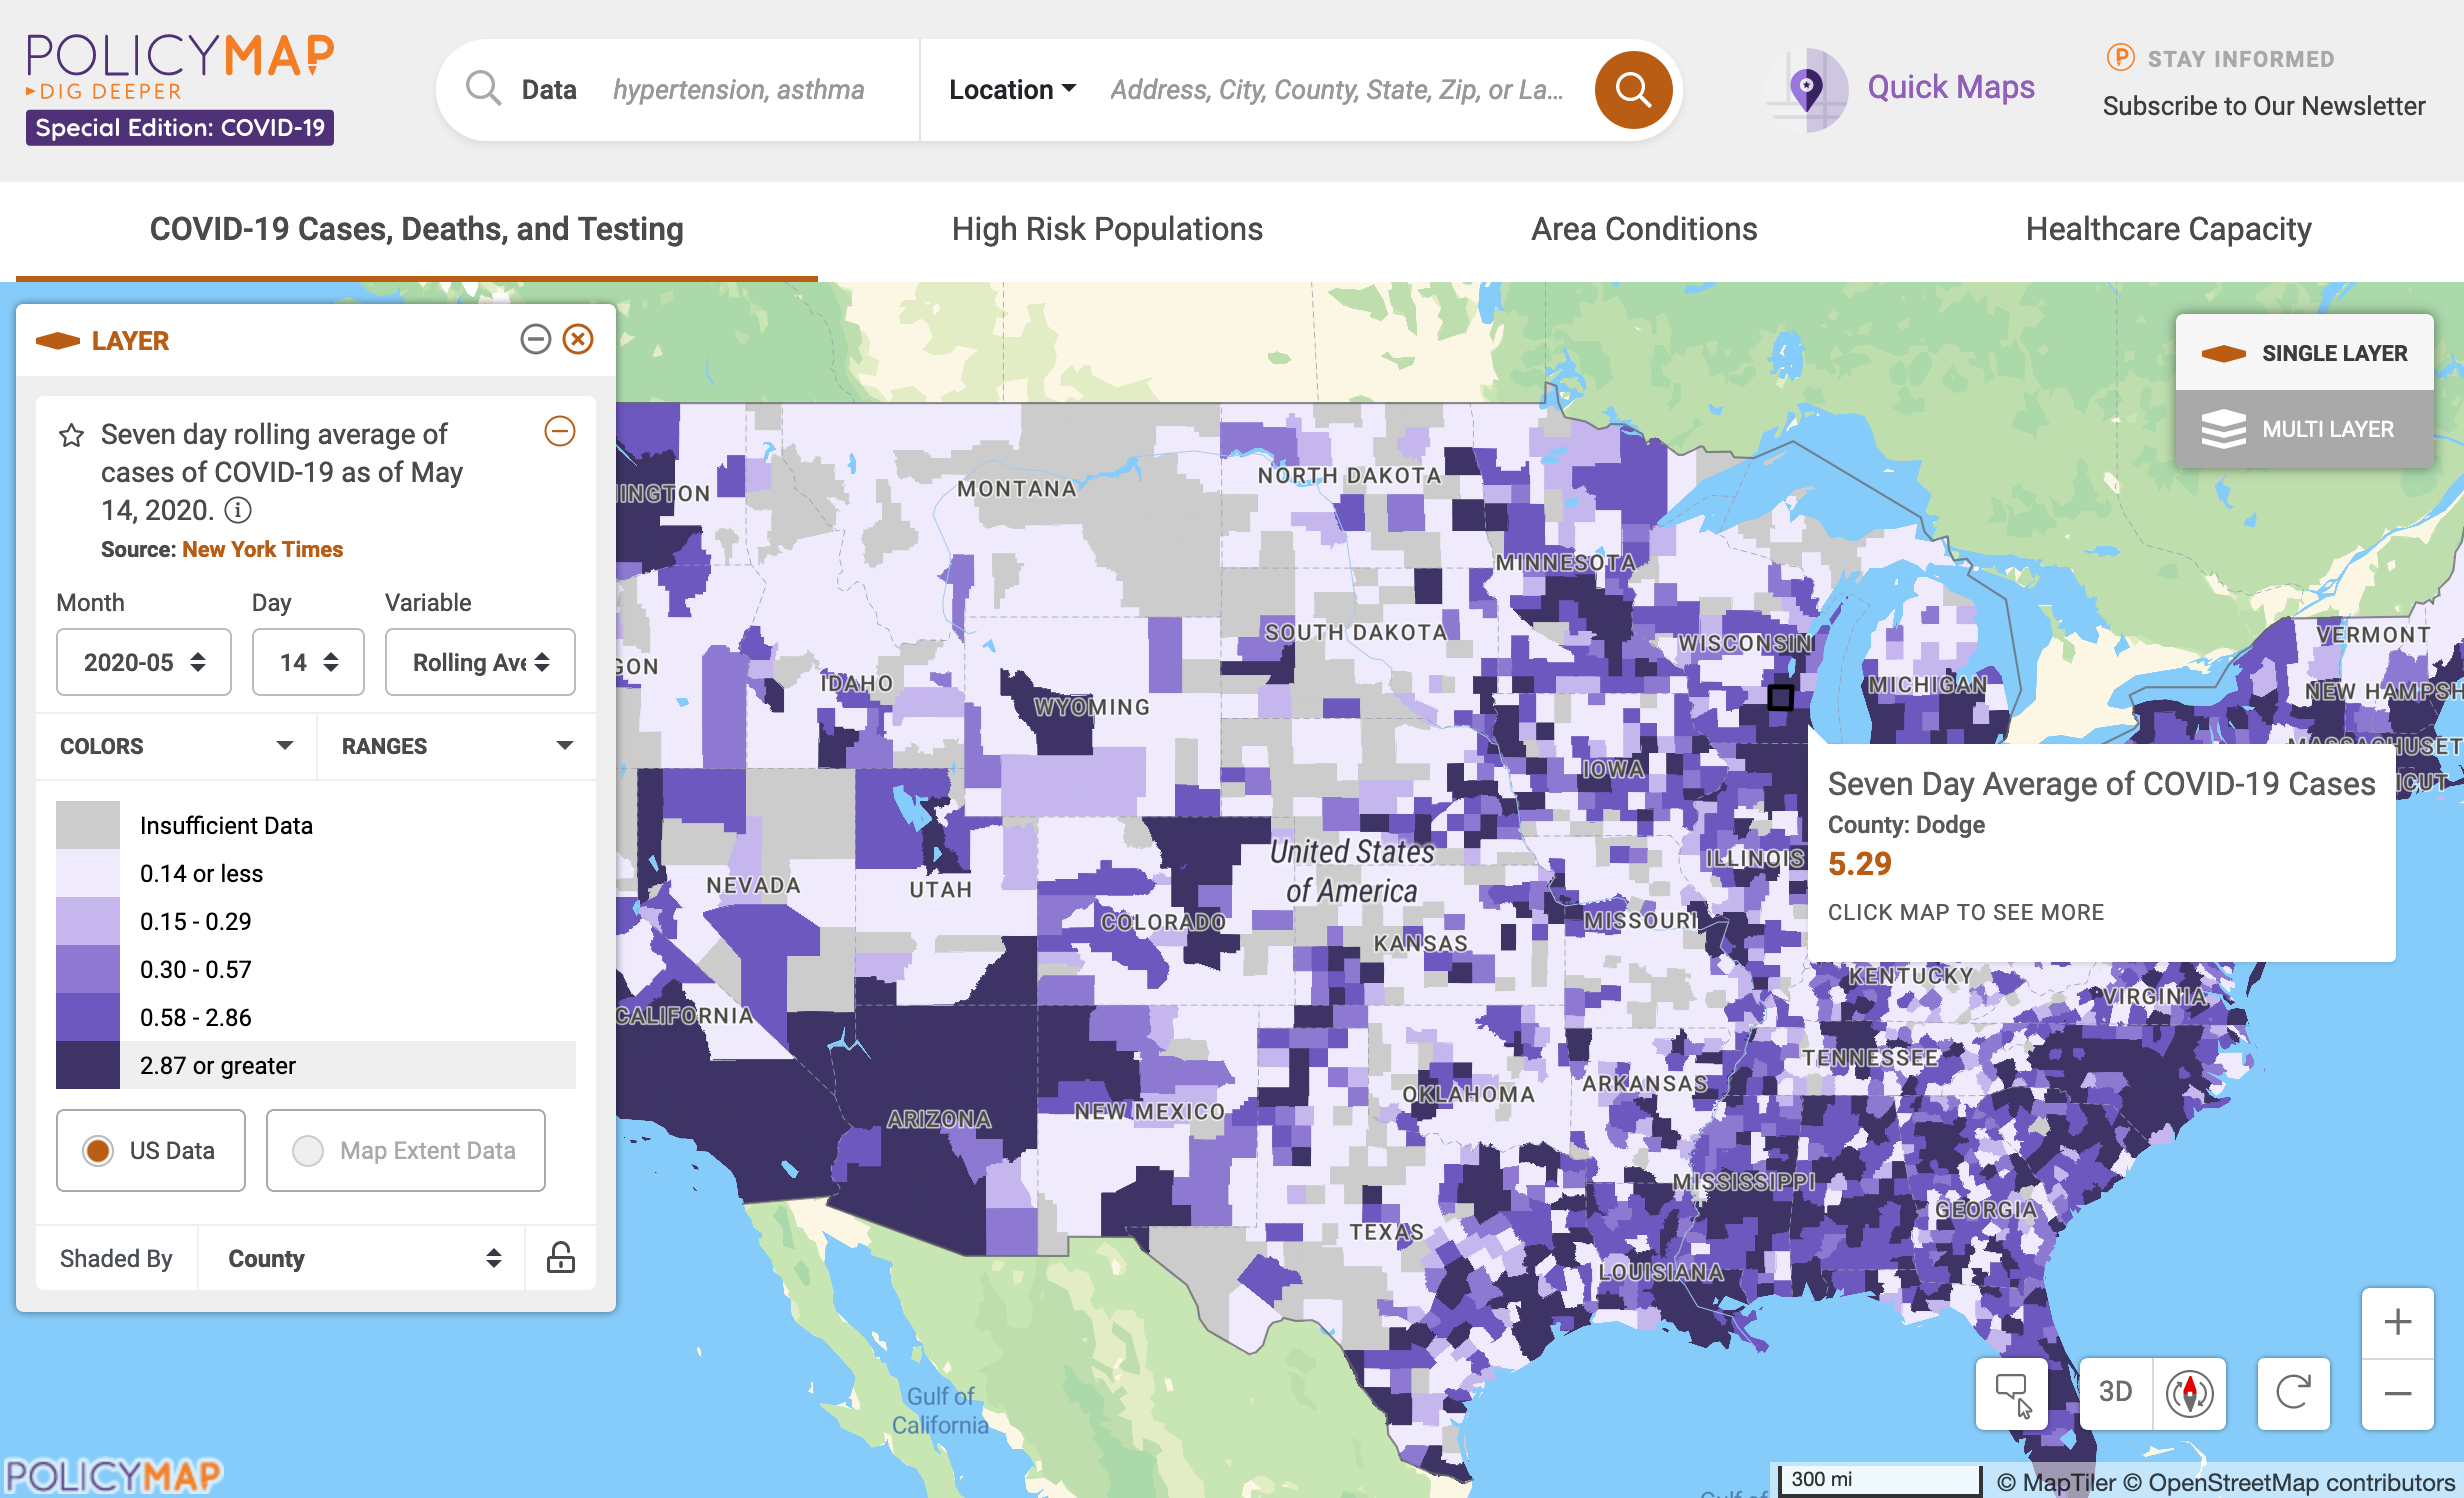
This new tool is built on the beta version of our new platform which, among other things, allows for the layering of up to five indicators to identify those places most in need. As a small business and Benefit Corporation, we are committed to making this available as a public resource given the current pandemic.
If you need more data and tools for your work beyond what is provided here, please contact us. PolicyMap maintains almost 50,000 indicators from over 150 sources for communities across the United States that can aid in the development of strategic plans and interventions.