
New Boxwood Means home sale data, Q3 2012
Update (06/09/2021): PolicyMap now has home sale data from Moody’s Analytics. Read more here.
2012 saw more home sales nationwide than any year for the past five years, according to the National Association of Realtors. For the first time in a while we are beginning to hear about a shrinking supply and looming increases in interest rates (see for example the New York Times).
PolicyMap has just updated our home sales data to include transactions from the third quarter of 2012. While national numbers come out very quickly, it takes somewhat longer to gather the detailed information at the county, ZIP code, tract, and block group geographies. The reason for the lag-time is that it can take months for counties to record individual transactions. Our home sales data comes from Boxwood Means, Inc., a re-seller of CoreLogic’s real estate data. Login now to see how the data is trending in your community.
Home sale data is available exclusively to our standard and premium subscribers. Sign up now to explore this dataset, or set up a free trial to check it out.

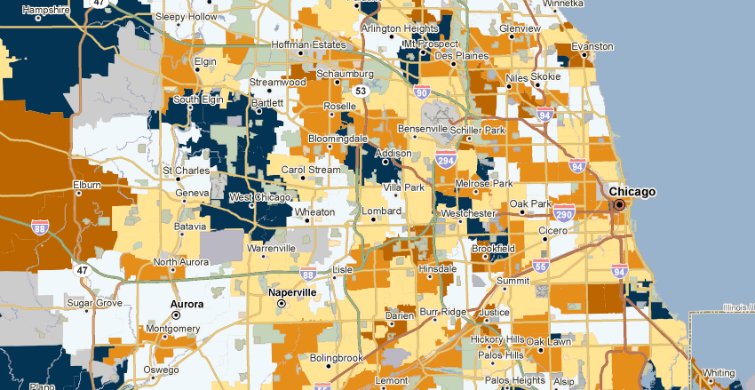
Meanwhile, here is a static map to whet your appetite. It shows the percent change in the number of homes sold in the last year in Chicago. The darkest purple indicates zip codes where the number of sales is increasing the fastest, while orange indicates a decline in the number of sales. As you can see the trends in number of sales are varied, with some of the strongest increase in sales occurring in southwest Chicago.