
2012 Home Sale Data: Exploring 6-Year Trends
Update (06/09/2021): PolicyMap now has home sale data from Moody’s Analytics. Read more here.
Recent interest rate increases have led many to anticipate a dip in the home sale market. However, as the Commerce Department recently reported, home sales in June rose at their fastest rate in five years. According to the New York Times, sales of single-family homes rose 8.3% to a seasonally adjusted rate of 497,000 units.
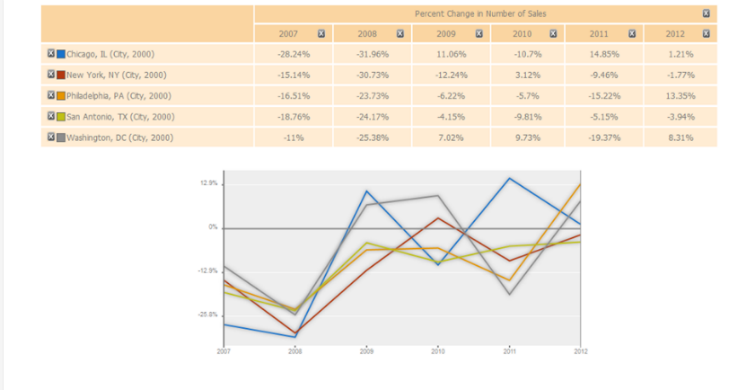
PolicyMap decided to take a look at these trends in several cities across the country using our newly updated 2012 home sale data from Boxwood Means. We looked at the percent change in the number of homes sold each year for the last six years in some of the largest cities across the country – Chicago, New York, Philadelphia, San Antonio, and Washington DC.
As you can see in the PolicyMap trend chart below, there are some differences from city to city. Washington DC saw a jump in 2009 and 2010, and a more significant drop in 2011. Meanwhile, Chicago sales have been increasing faster generally than in the other cities. Overall though, this chart seems to bear out the findings of the Commerce Department: After a widespread dip in 2007 and 2008, we are generally seeing increasing rates of sales in these cities.

Although sales are trending in the right direction, it’s important to note that the number of sales is still much lower than it was in 2006 when the market was closer to its peak. As the table below bears out, these cities have universally seen a drop in the number of sales.

Interested in exploring home sale trends in your own city? Or looking more locally at trends in your neighborhood or zip code? PolicyMap’s home sale data is available exclusively to our standard and premium subscribers. Sign up now to explore this dataset, or set up a free trial to check it out.