
New Oil and Gas Production Data from the USDA
PolicyMap is excited to announce that natural gas and on-shore oil production data from the U.S. Department of Agriculture – Economic Research Service is now available in our new Economy menu.
The development of hydraulic fracturing, or “fracking”, in the 1990s has allowed us to tap into new sources locked in shales deep below the earth’s surface. According to the U.S. Energy Information Administration, natural gas production increased 25% since 2000 and is projected to increase another 44% by 2040. Meanwhile crude oil production this year is set to surpass its 1970 high of 9.6 million barrels per day. Oil and natural gas are now the two largest sources of primary energy in the United States, making up nearly two thirds of our supply.
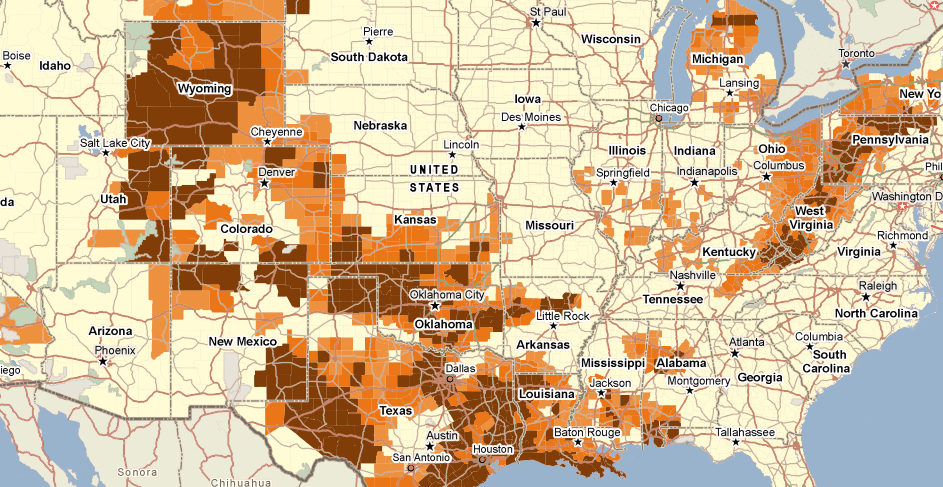
Energy production is focused primarily in a handful of shales including the Haynesville shale in Texas and Louisiana, the Marcellus in Pennsylvania and West Virginia, and the Bakken in North Dakota. The location of these shales is evident on the map below showing total gross withdrawals of natural gas in 2011.
The growth of fracking has prompted intense debate on many fronts. Fracking involves injecting a mixture of chemicals and large quantities of water into wells, threatening aquifers and potentially contaminating local water supplies. Environmentalists are also very concerned about methane emissions from wells and proper storage and disposal of leftover waste.
The growth of oil and gas extraction also presents economic opportunities. North Dakota is experiencing an economic boom from the fracking of the Bakken shale; they have a 2.6% unemployment rate and a rapidly growing population. Pennsylvania and Ohio’s experience is still unfolding with ongoing debate about taxing gas extraction from the Marcellus shale. Wage data from the Bureau of Labor Statistics (BLS) suggest that fracking creates high-wage jobs. The maps below show the average wage across all industries compared to the average wage in the oil and gas extraction industry. The darker shades of purple on the oil and gas extraction map indicate the higher overall wages offered from this industry.
Oil and natural gas production data is available for counties throughout the country for 2000 through 2011. You will also find estimated value of total production as well as percent changes in production and value over time.