
Preserving LIHTC Units: A Key Strategy in Addressing Housing Shortages

New research from Moody’s Analytics, PolicyMap, and Reinvestment Fund offers the most detailed look yet at the U.S. housing shortage, drilling all the way down to the census tract level. The analysis highlights a critical reality: in the low-income neighborhoods studied, rental units account for 80% of the housing stock, underscoring the importance of affordable rental options in these neighborhoods.
One of the most powerful tools the U.S. has for meeting this need is the Low-Income Housing Tax Credit (LIHTC) program. Since its creation in 1986, LIHTC has been the country’s largest driver of affordable rental housing development. Ensuring these developments remain affordable, particularly in communities already strained by a lack of rental housing, is essential for any long-term housing strategy.
What the Housing Gap Analysis Reveals
Our study with Moody’s Analytics and Reinvestment Fund covered census tracts in 350 U.S. cities and found that overall, housing stock is fairly balanced: 51% rental and 49% owner-occupied. But breaking the data down by tract income level reveals stark differences and makes clear the particular need for affordable rental opportunities in low and moderate-income neighborhoods:
- Low-income tracts: 80% rental, 20% owner
- Moderate-income tracts: 65% rental, 35% owner
- Middle-income tracts: 50% rental, 50% owner
- High-income tracts: 36% rental, 64% owner
How LIHTC Works
Rather than directly building housing, the federal government uses LIHTC to leverage private capital. Investors, often banks or corporations, receive a dollar-for-dollar reduction in their federal tax liability in exchange for financing affordable housing developments.
In return, property owners agree to:
- Reserve a share of units for tenants earning 60% or less of Area Median Income (AMI)
- Cap rents so tenants pay no more than 30% of their income
- Maintain affordability for at least 30 years in most cases
But once this compliance and extended-use period ends, owners are no longer bound by LIHTC rules. At that point, they can:
- Raise rents to market levels
- Convert units to another use
- Reapply for new LIHTC credits to extend affordability
The looming expiration of affordability restrictions has been a major housing policy concern.
Mapping Risk and Need Together
PolicyMap’s integration of the Moody’s Gap Analysis allows us to pinpoint where affordable units are most needed—and where existing LIHTC units are at risk of expiring.
Take Atlanta as an example:
- Dark orange tracts show the highest need for rental housing.
- White tracts have a relatively adequate supply.
- Purple tracts show a surplus.
- Red dots mark LIHTC properties with affordability restrictions set to expire between 2026 and 2030.
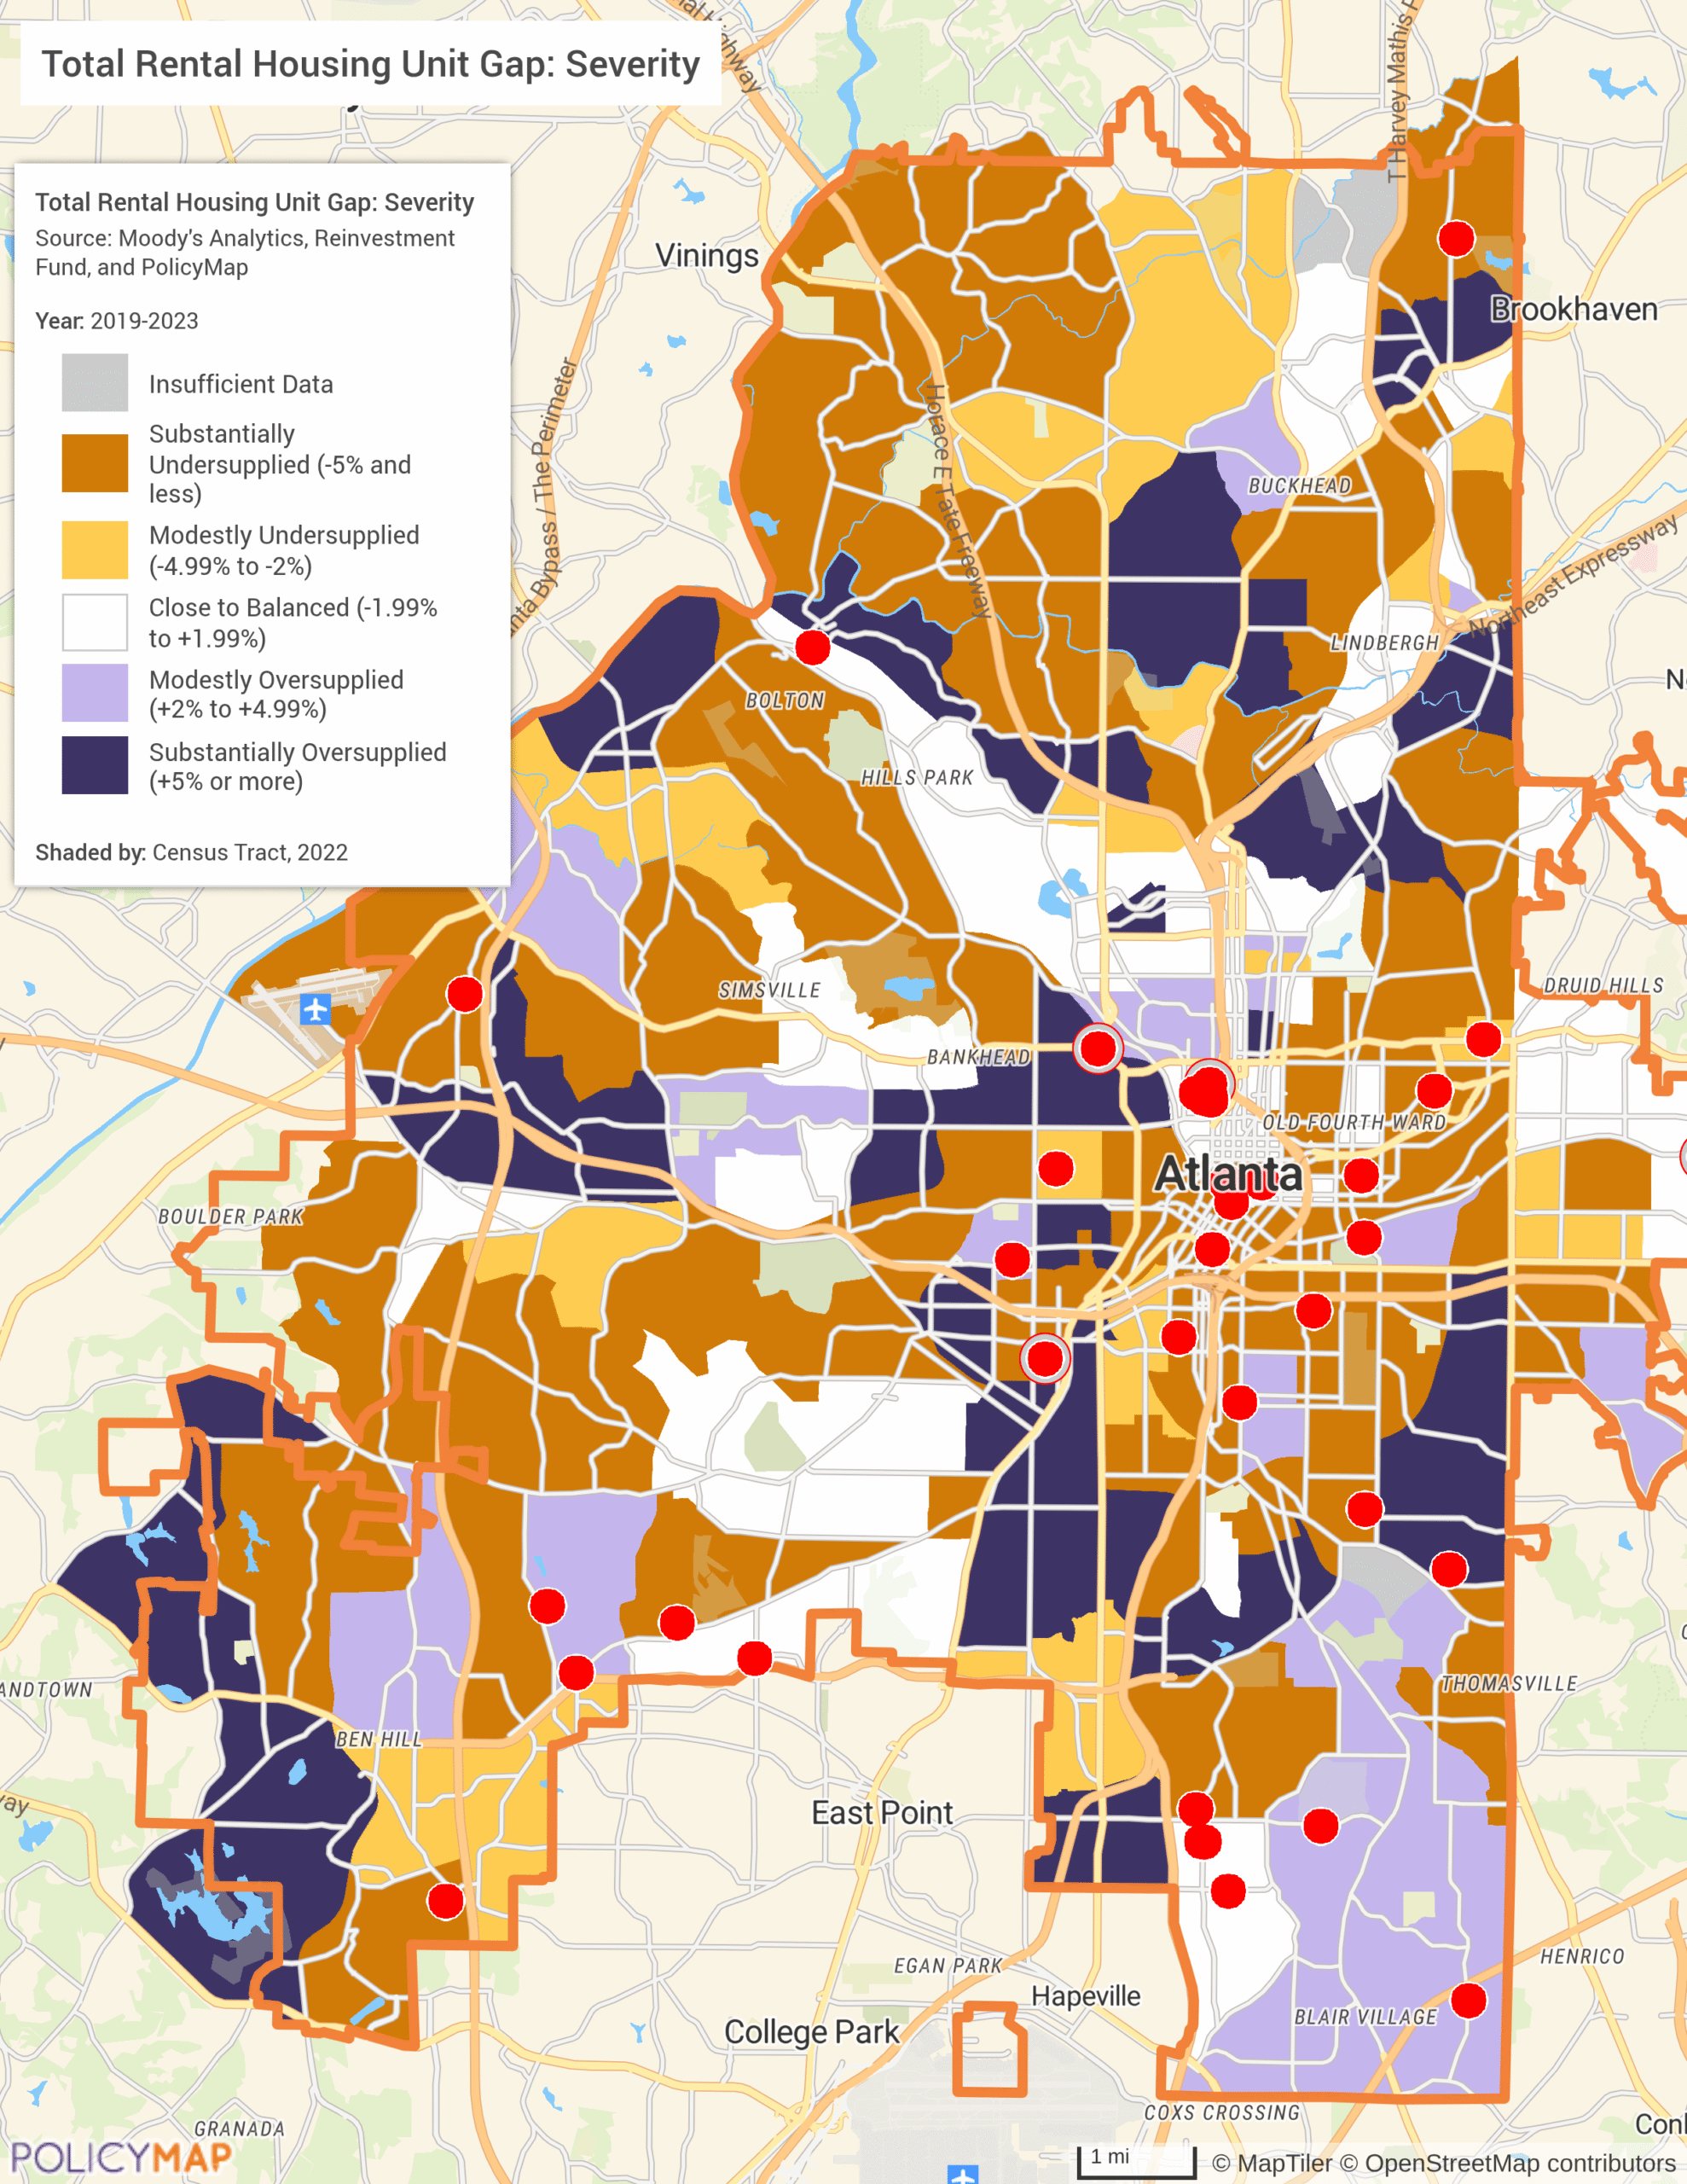
Overlaying these datasets reveals exactly which high-need areas (dark orange) are at risk of losing affordable units (red dots).
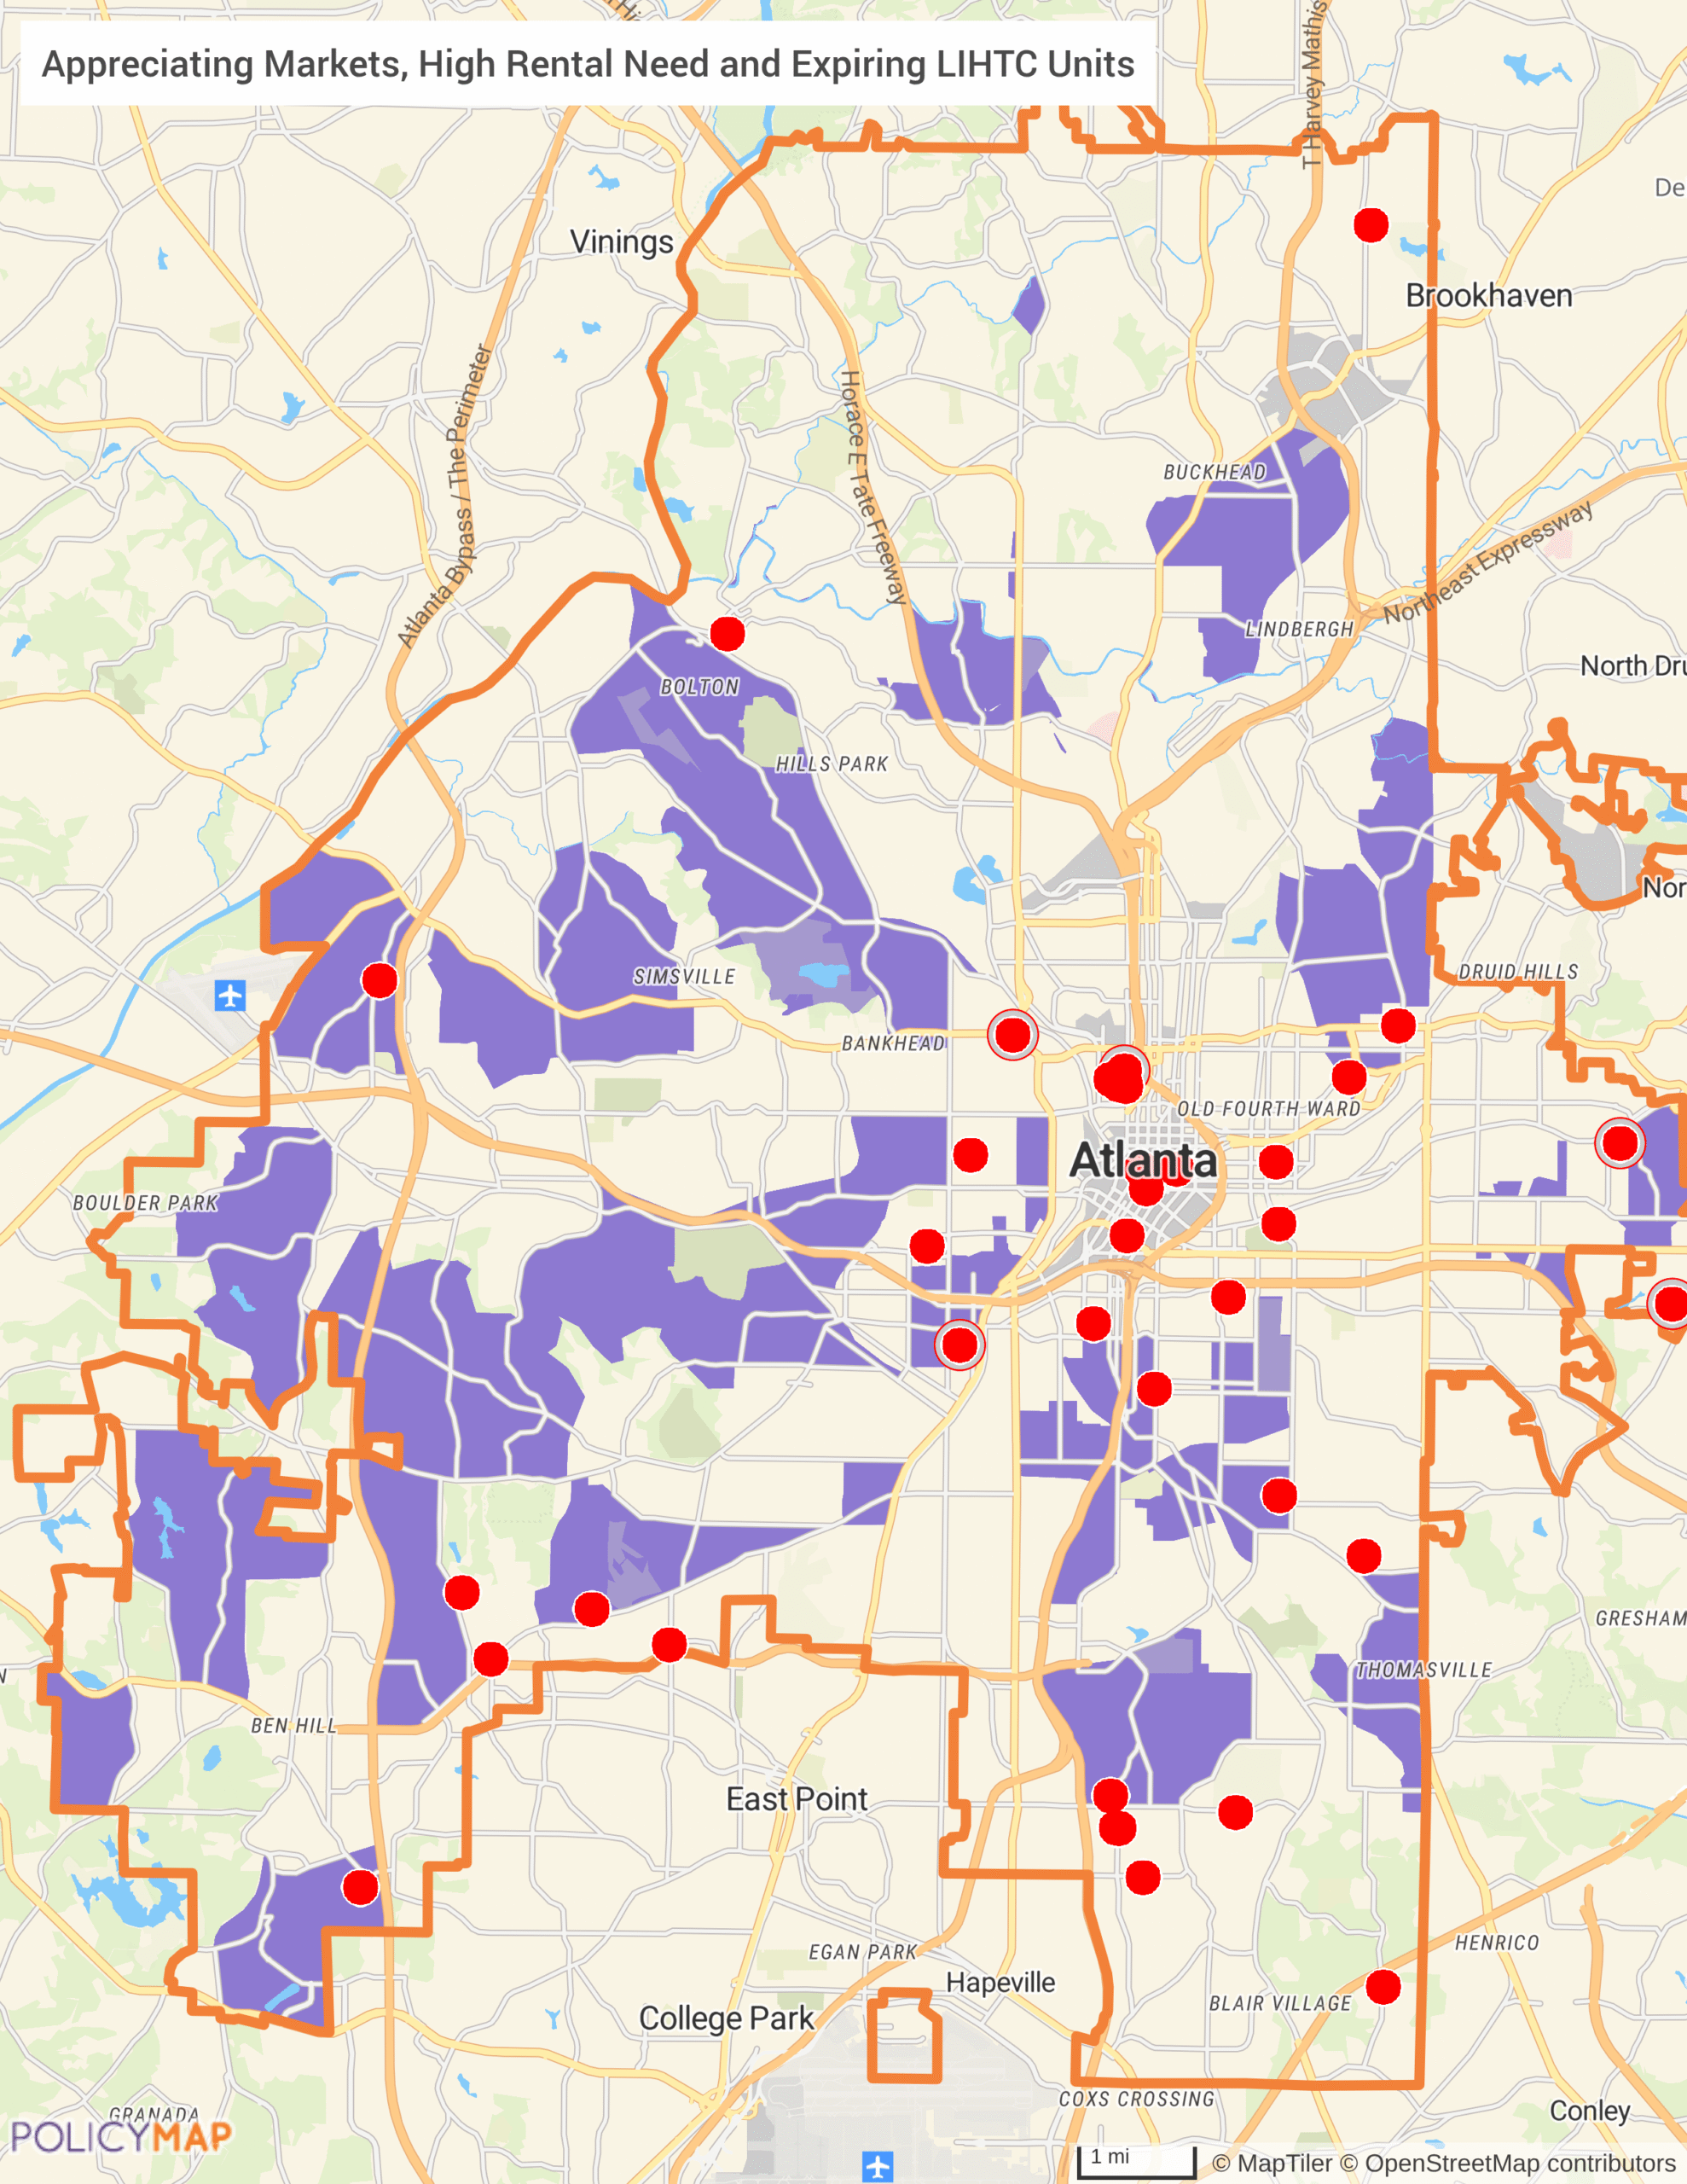
The risk, however, can be especially pronounced in stronger housing markets, where property owners may be more likely to raise rents once restrictions expire.
These stronger housing markets can be identified by adding home sale data from Black Knight. Looking at tracts where home sale prices have climbed more than 50% in the past 5 years AND tracts that have a high rental need pinpoint neighborhoods where the loss of LIHTC units could be most damaging. In Atlanta, these tracts are highlighted in purple and reveal at-risk properties to the south and southeast- stronger markets in areas already short on rental housing.
Why This Matters
As more LIHTC properties approach the end of their affordability periods, preservation efforts are an essential part of affordable housing plans. Mapping tools like PolicyMap help planners, policymakers, and advocates not only see where the gaps are, but also anticipate where those gaps could deepen if affordability is lost.
Request More Information
Want to see how PolicyMap can help you identify housing gaps and assess LIHTC preservation risks in your community? Fill out the form to request a demo, explore pricing, or learn more about how our data and mapping tools support smarter housing strategies. Our team will be in touch to guide you through the options.