
3D Building Footprints Now Available for More of the US
Did you know that PolicyMap users can visualize 3D building footprints when making maps? These footprints provide users with additional insights and visualizations when looking to understand neighborhood level data. The most recent upgrades to these base maps now provide building footprints far beyond just downtown high rises.
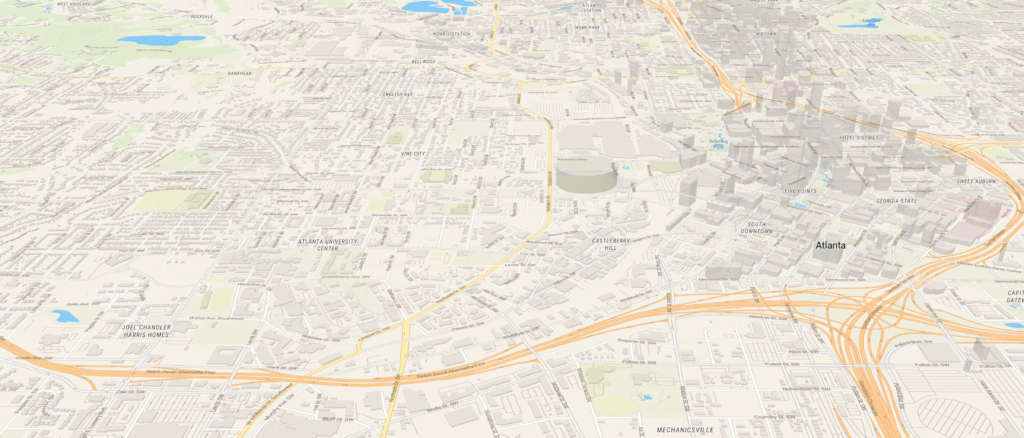
Building footprints can show us how dramatically density changes from block-to-block in some cities.
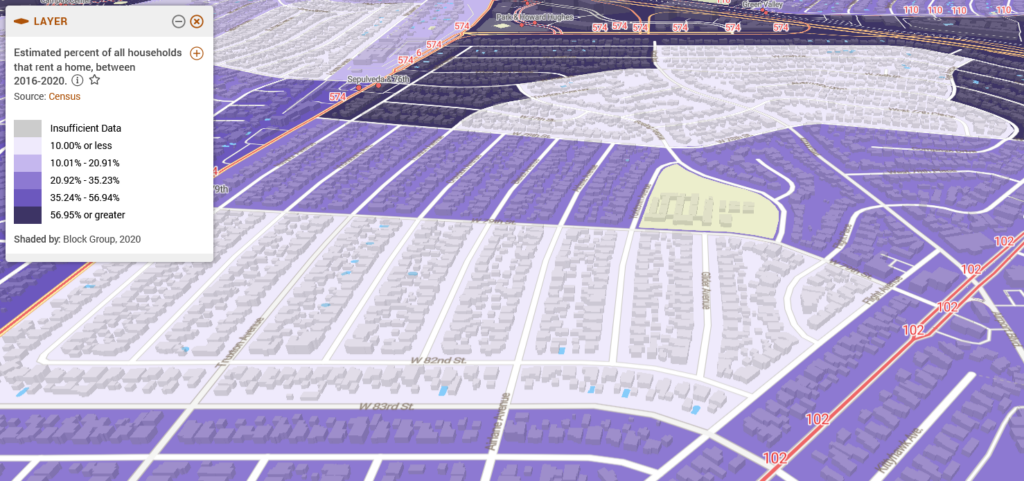
They can show us how, in some places, transit lines are concentrated in areas where households predominantly rent.
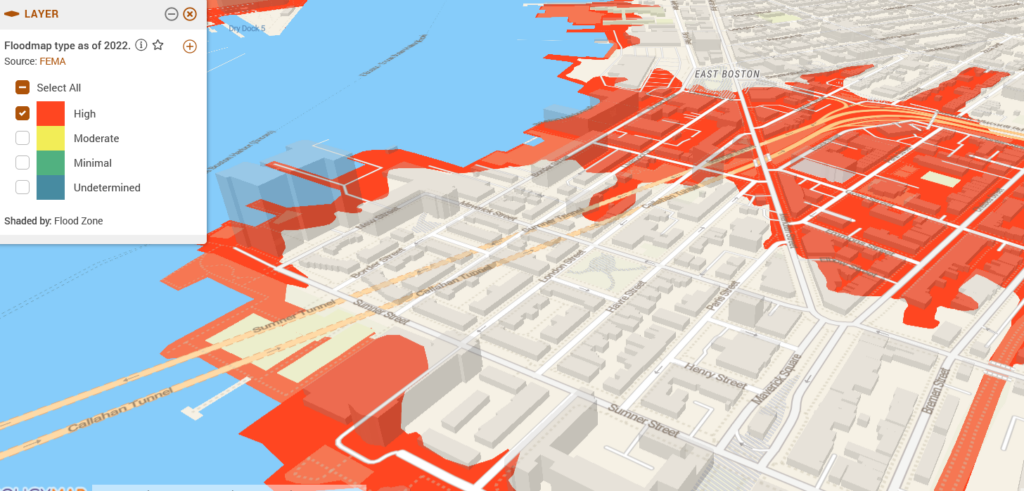
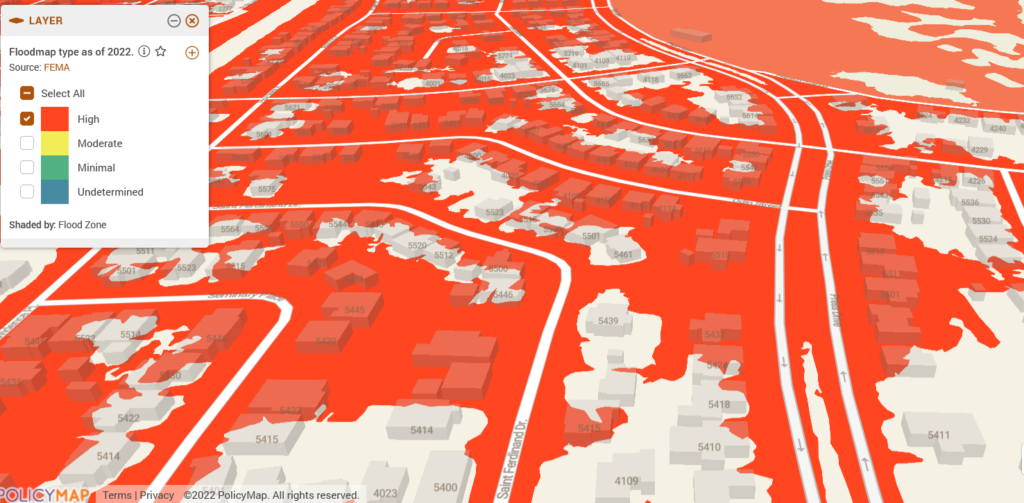
They can help us understand what buildings or specific parts of an area sit within high-risk flood zones.
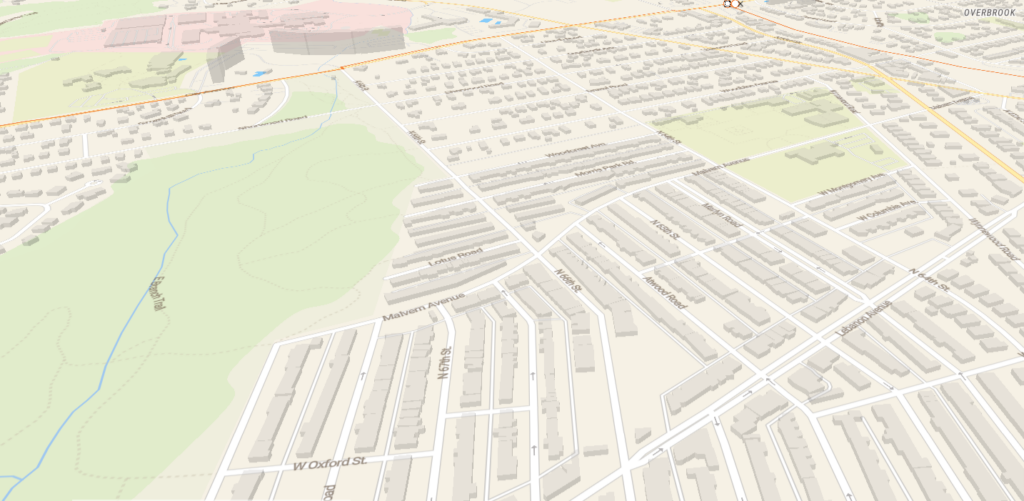
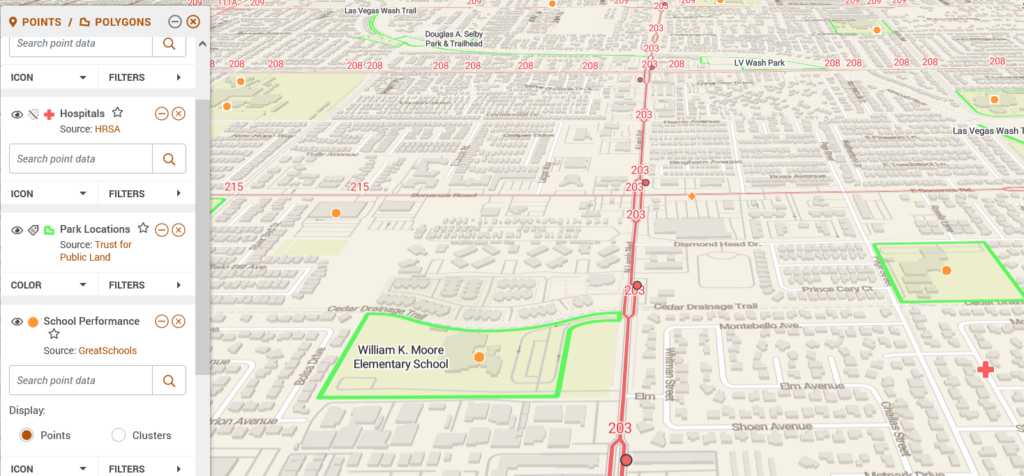
And, they allow us to understand the overall infrastructure of a neighborhood. Footprints enable users to see industrial areas as compared to residential areas. When overlaid with transit lines, parks, schools, hospitals and other points of interest, they provide a holistic view of the layout of a community.
Users can reveal these building footprints simply by zooming in on the map. To give the building a 3D view, just click on the 3D button on the bottom right of the application, as shown below:
For more information on the most recent upgrades to our base maps or to learn more about using 3D building footprints in your analysis, contact us.