
Strategic Partnership: Epistemix Leverages PolicyMap Data to Revolutionize Predictive Analytics
Advancements in data science are making the shift from descriptive to predictive analytics increasingly accessible, empowering organizations to gain deeper insights into human behavior and adaptability.
Epistemix is a computational modeling company that uses advanced modeling techniques to simulate the spread of diseases, assess the impact of interventions, and make predictions about population health outcomes. They help organizations make the shift to predictive analytics through the creation of their synthetic population of the entire United States. Synthetic populations can be used to test “what if” scenarios and see how strategies play out by coding behavioral assumptions into models, not by only looking backward at collected results.
PolicyMap provides the data front end for these analytics, visualizing the before and after across each “what if” scenario. This collaboration empowers decision-makers with actionable insights, facilitating a deeper understanding of the potential outcomes of various strategies, including:
- Shifting from volume-based to value-based care: Healthcare organizations can simulate “what-if” scenarios of different interventions before making bets on what program is most likely to improve outcomes in the populations they are targeting.
- Minimizing unintended consequences: By simulating outcomes under different future conditions, government leaders can increase the quality and confidence of their decisions.
- Forecasting demand and planning utilization: Life sciences companies can simulate the diseases of the population, then the interaction with the health system (going to the doctor, getting a prescription), and then where people are most likely to go to get their prescription filled; all while being able to test strategies to increase utilization and adherence.
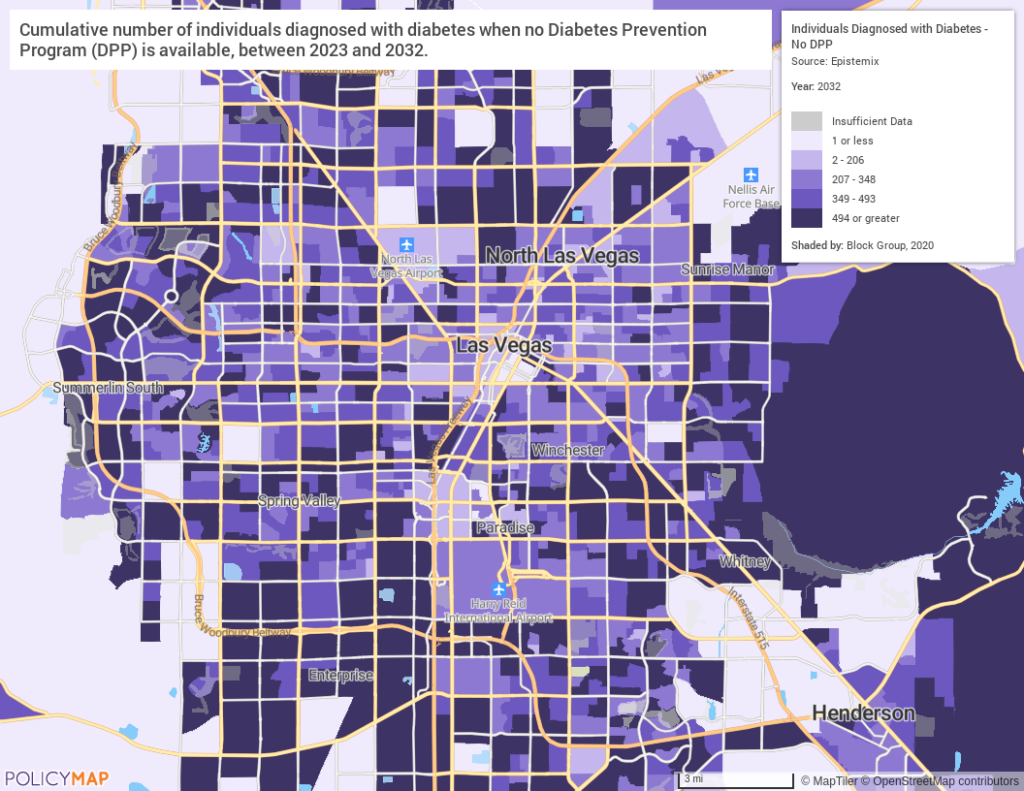
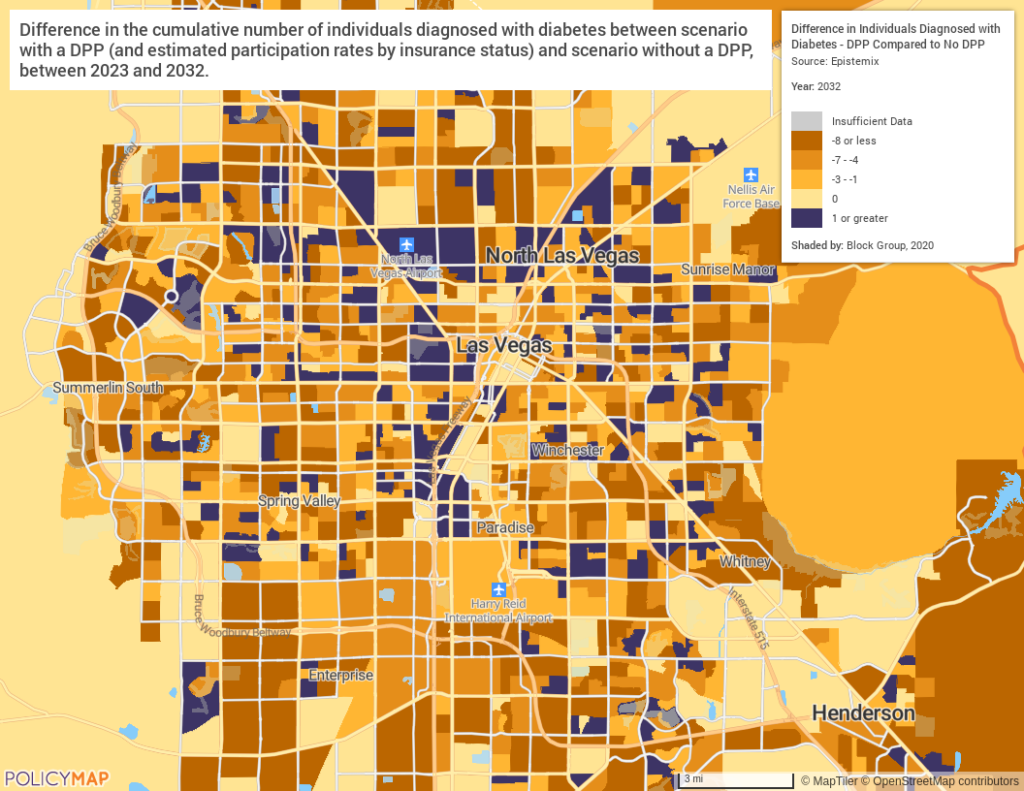
See how Epistemix developed an agent-based simulation model of the impact of a diabetes prevention program (DPP) on diabetes prevalence in the state of Nevada during the period 2023-2032 in the example below. It allows the comparison of diabetes prevalence across US Census Block Groups for the simulated period under three scenarios:
Scenario 1: No DPP is available
Scenario 2: A DPP is available with current estimated participation rates by insurance status
Scenario 3: A DPP is available where everyone has the same participation rate as those with private insurance currently do, irrespective of their insurance status
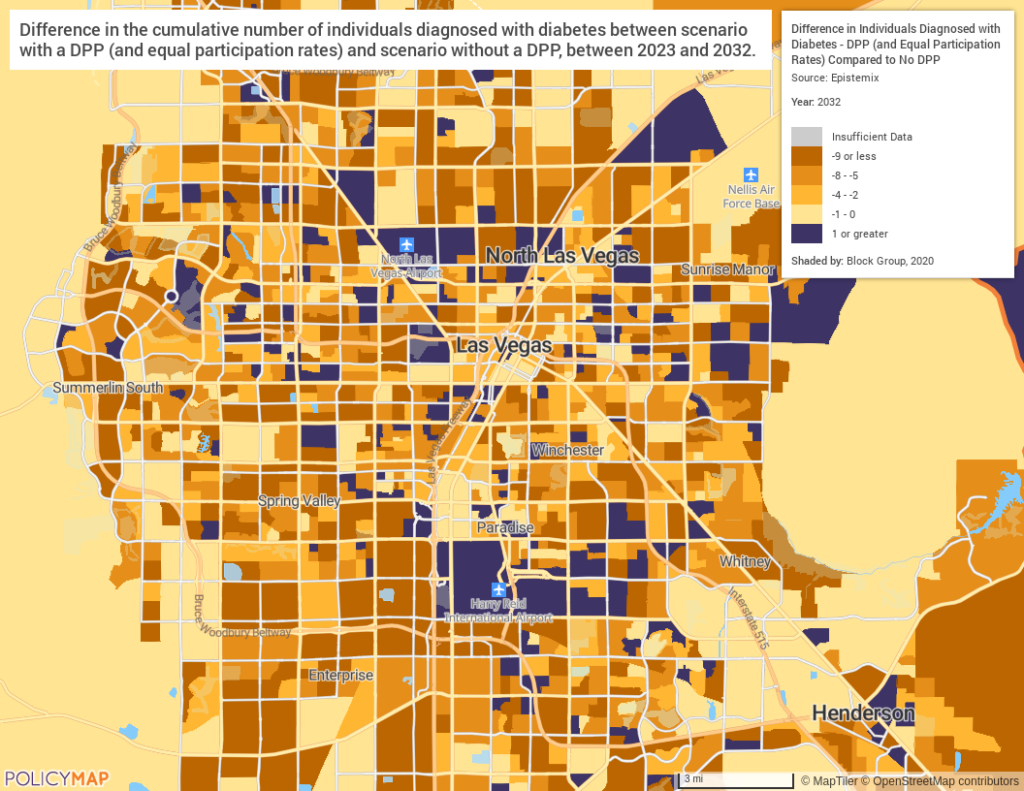
The use of a simulation model to combine information about an individual’s likelihood of being overweight with information about their likelihood of participating in a DDP by insurance status allowed Epistemix to project the population-level effect of a DPP in Nevada over a 10-year time period. As displayed in the visualizations above, Scenario 2 showed an average decrease in diabetes incidence of 1.1% (7488 fewer cases) across all block groups for the simulated period 2023-2032 compared to Scenario 1 in which a DPP was not available. Correspondingly, Scenario 3, in which individuals without private insurance had the same likelihood to participate as those with private insurance, showed an average decrease in incidence of 1.3% (8845 fewer cases over 10 years) compared to Scenario 1.
Explore How PolicyMap’s Data and Visualizations Can Power Your Predictive Analytics
Interested in a demo of PolicyMap’s data visualization platform or learning more about our data sources? Get in touch using the form below.