
PolicyMap for Community Health
Use PolicyMap as a single point of entry to evaluate trends, access benchmarks, and strategically target interventions designed to improve health outcomes. Have access to easy-to-use mapping tools for data on social determinants of health, health outcomes, housing and environmental conditions, and more.
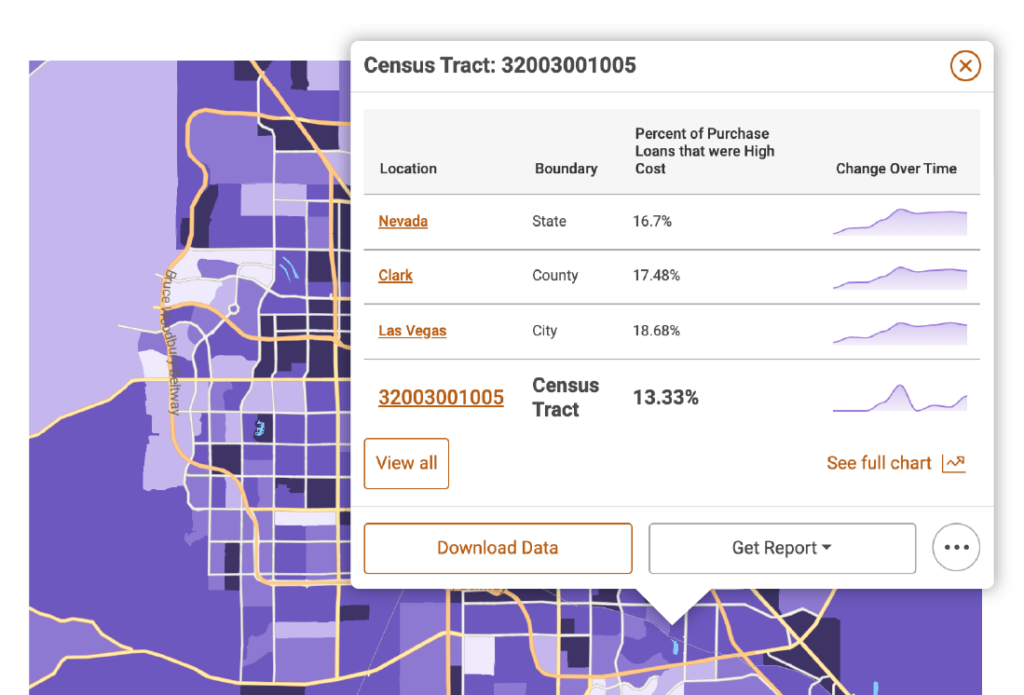
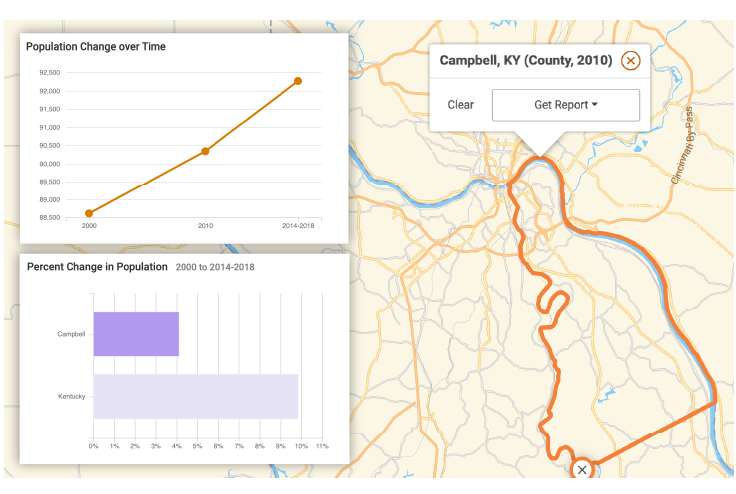
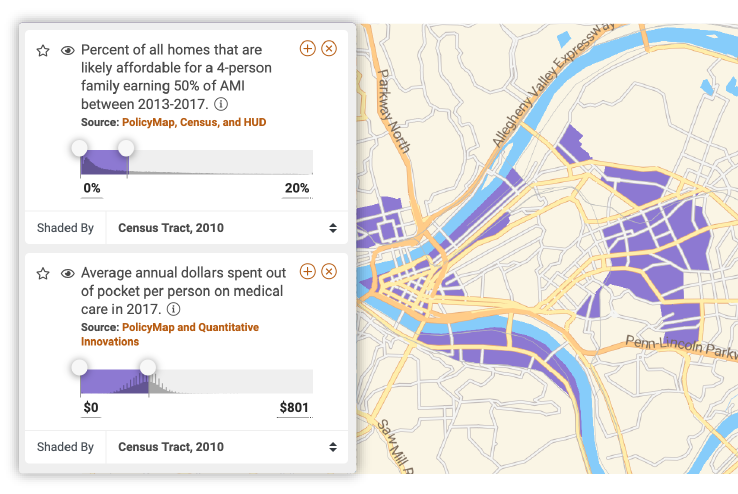
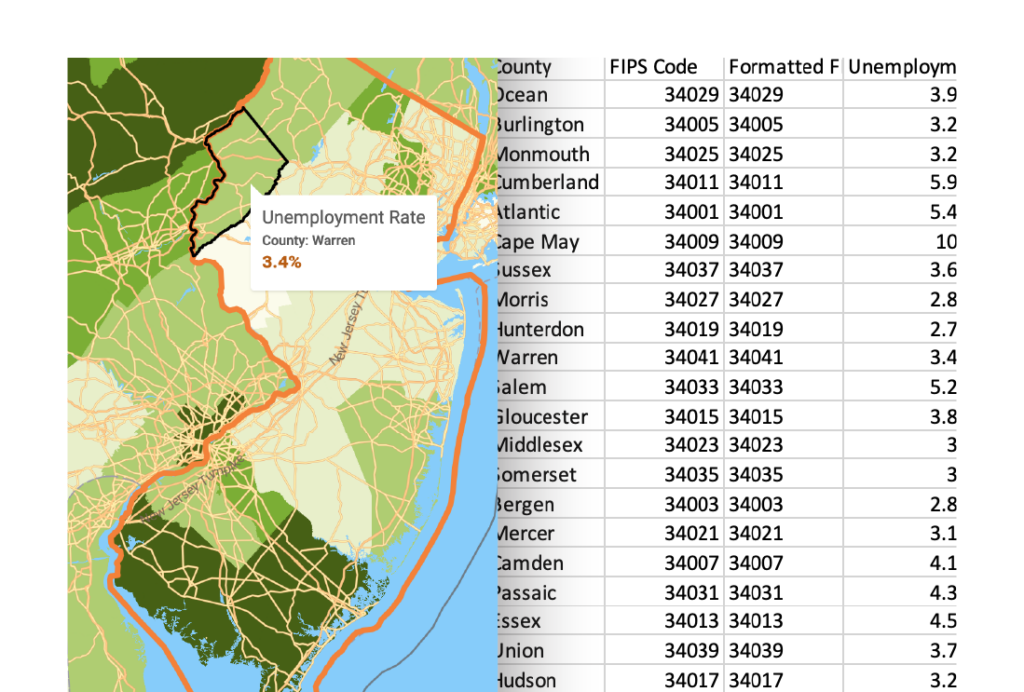
By using exclusive data at the census tract and zip code geographic level, you can gain insights into specific neighborhoods that aren’t possible with county-level data alone.

Download: Improving Health Equity Through Data
Use PolicyMap to inform and simplify your health equity initiatives. Create data-driven Community Health Needs Assessments, Strategic Plans, Primary Care Needs Assessments, and more. To learn more about our data topics and sources, download the brochure.


Data for Community Health
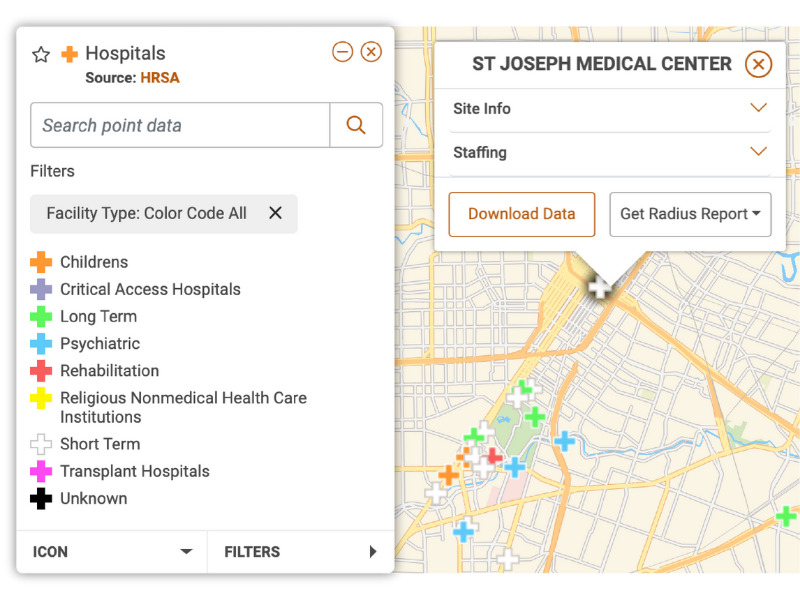
PolicyMap contains a wide array of community-level health data, ranging from the incidence of diseases and chronic conditions to locations of health infrastructure and key social determinants of health. Valuable data is available at the census tract and zip code level, for neighborhood-level insights.

COVID-19

Life Expectancy

Insured And Uninsured Populations

Opioid Use

People With Disabilities

Healthy Food Access

Healthcare Access

Disease Prevalence

Community Assets

Medical Spending*

Risk Factors*
*Exclusive Data. PolicyMap’s expert data team uses advanced small-area estimate methodology to generate data at the census tract and zip code level, which gives insights into specific neighborhoods that aren’t available with county-level data available elsewhere.
See how PolicyMap can help your organization.
Schedule a personalized demonstration to:
- Browse social determinants of health indicators and data sources
- Understand how customers use PolicyMap to plan and evaluate health equity initiatives
- License thousands of indicators from hundreds of sources, including primary PolicyMap data, through a single vendor
Customer Stories

Maricopa County Department of Public Health
To conduct Community Health Assessments, the Maricopa County Department of Public Health utilizes PolicyMap’s neighborhood-level data and stunning visualizations to develop action plans, supplement patient-level data, create community profiles, and communicate results.
Social determinants of health are an underlying factor affecting the sustained health of individuals served by Northwell Health. To address these neighborhood-level determinants, Northwell’s Community Health team sought a way to locate and quantify the effects of various determinants on patient health. Using accessible, curated data from PolicyMap, Northwell is developing end-to-end individual and community-level social vulnerability risk indices to better inform both providers and patients to improve health in communities in their service area.

Apple Tree Dental, a healthcare nonprofit dedicated to oral health equity, is on a mission to remove barriers to oral health including transforming health care policy. PolicyMap makes it possible for their team to better identify disparities and present necessary data for legislative change.
Understand social determinants of health
Improve health outcomes by understanding the socioeconomic conditions and other social determinants of health in the communities in which you work.
Inform your organization with more accurate insights
Use exclusive data at the neighborhood and zip code level to gain insights into communities that aren’t possible with county-level data alone.
Target health equity investments and initiatives
Strategically target investments, programs, and services to address community level health disparities.
Locate partners and community assets
Identify existing community assets such as housing providers, schools, supermarkets, clinics, and others with whom to partner on your initiatives.
License data to feed internal applications
License data from PolicyMap’s extensive data warehouse as a one-stop shop to feed your data lake, inform internal analytics, and enrich patient data with community-level data with an eye on health equity.
Join Our Mailing List
Sign up to receive data driven stories, insights and updates from the PolicyMap team.