
ACS Data Updated to 2020-2024

New Data Added!
New Census Tables:
- Population tables for Black or African American ancestry and White ancestry, providing estimates for selected groups.
New Indicators:
We expanded our data coverage with the following new variables:
Demographics
- Dependent age population — People under 18 or 65 and older
- Population 5 years and over who speak a language other than English at home
Children & Families
- Children under age 6 with all available parents in the labor force
- Women aged 15–50 who had a birth in the past 12 months
- Teen births — Women aged 15–19 who had a birth in the past 12 months
- Women aged 15–50 who had a birth in the past 12 months and are living in poverty
- Working mothers of infants — Women aged 16–50 who had a birth in the past 12 months and are in the labor force
Income
- Median income by household size
Housing
- Occupied housing units with monthly electricity costs of $100 or more
- Occupied housing units with monthly electricity costs of $200 or more
We’re excited to introduce the latest American Community Survey (ACS) data update, providing a richer, more detailed snapshot of U.S. communities. PolicyMap now features 2020-2024 ACS data, accessible through our interactive maps, charts, reports, and downloads. At PolicyMap, we believe in the power of data democracy; the idea that public data should be accessible to everyone, not just experts or institutions. Our platform simplifies how users explore, visualize, and understand public data, making critical insights available to all.
With nearly 8,000 updated indicators, this data refresh delivers the latest insights into population characteristics, spanning social, economic, housing, and demographic trends. PolicyMap broadened our data coverage to include dependent age population, language spoken at home, median income by household size, and the new Census Ancestry tables for Black or African American populations and White populations.
This release marks the first time four separate 5-year datasets are available for comparison. To dig deeper into trends, PolicyMap added 10-year percent change to all available indicators comparing 2005–2009 to 2020–2024
Explore the Latest ACS Data 2020-2024 Data on PolicyMap
Accessing and analyzing this data has never been easier. Our platform simplifies the process, allowing users to explore trends in demographics, income, and housing affordability with just a few clicks.
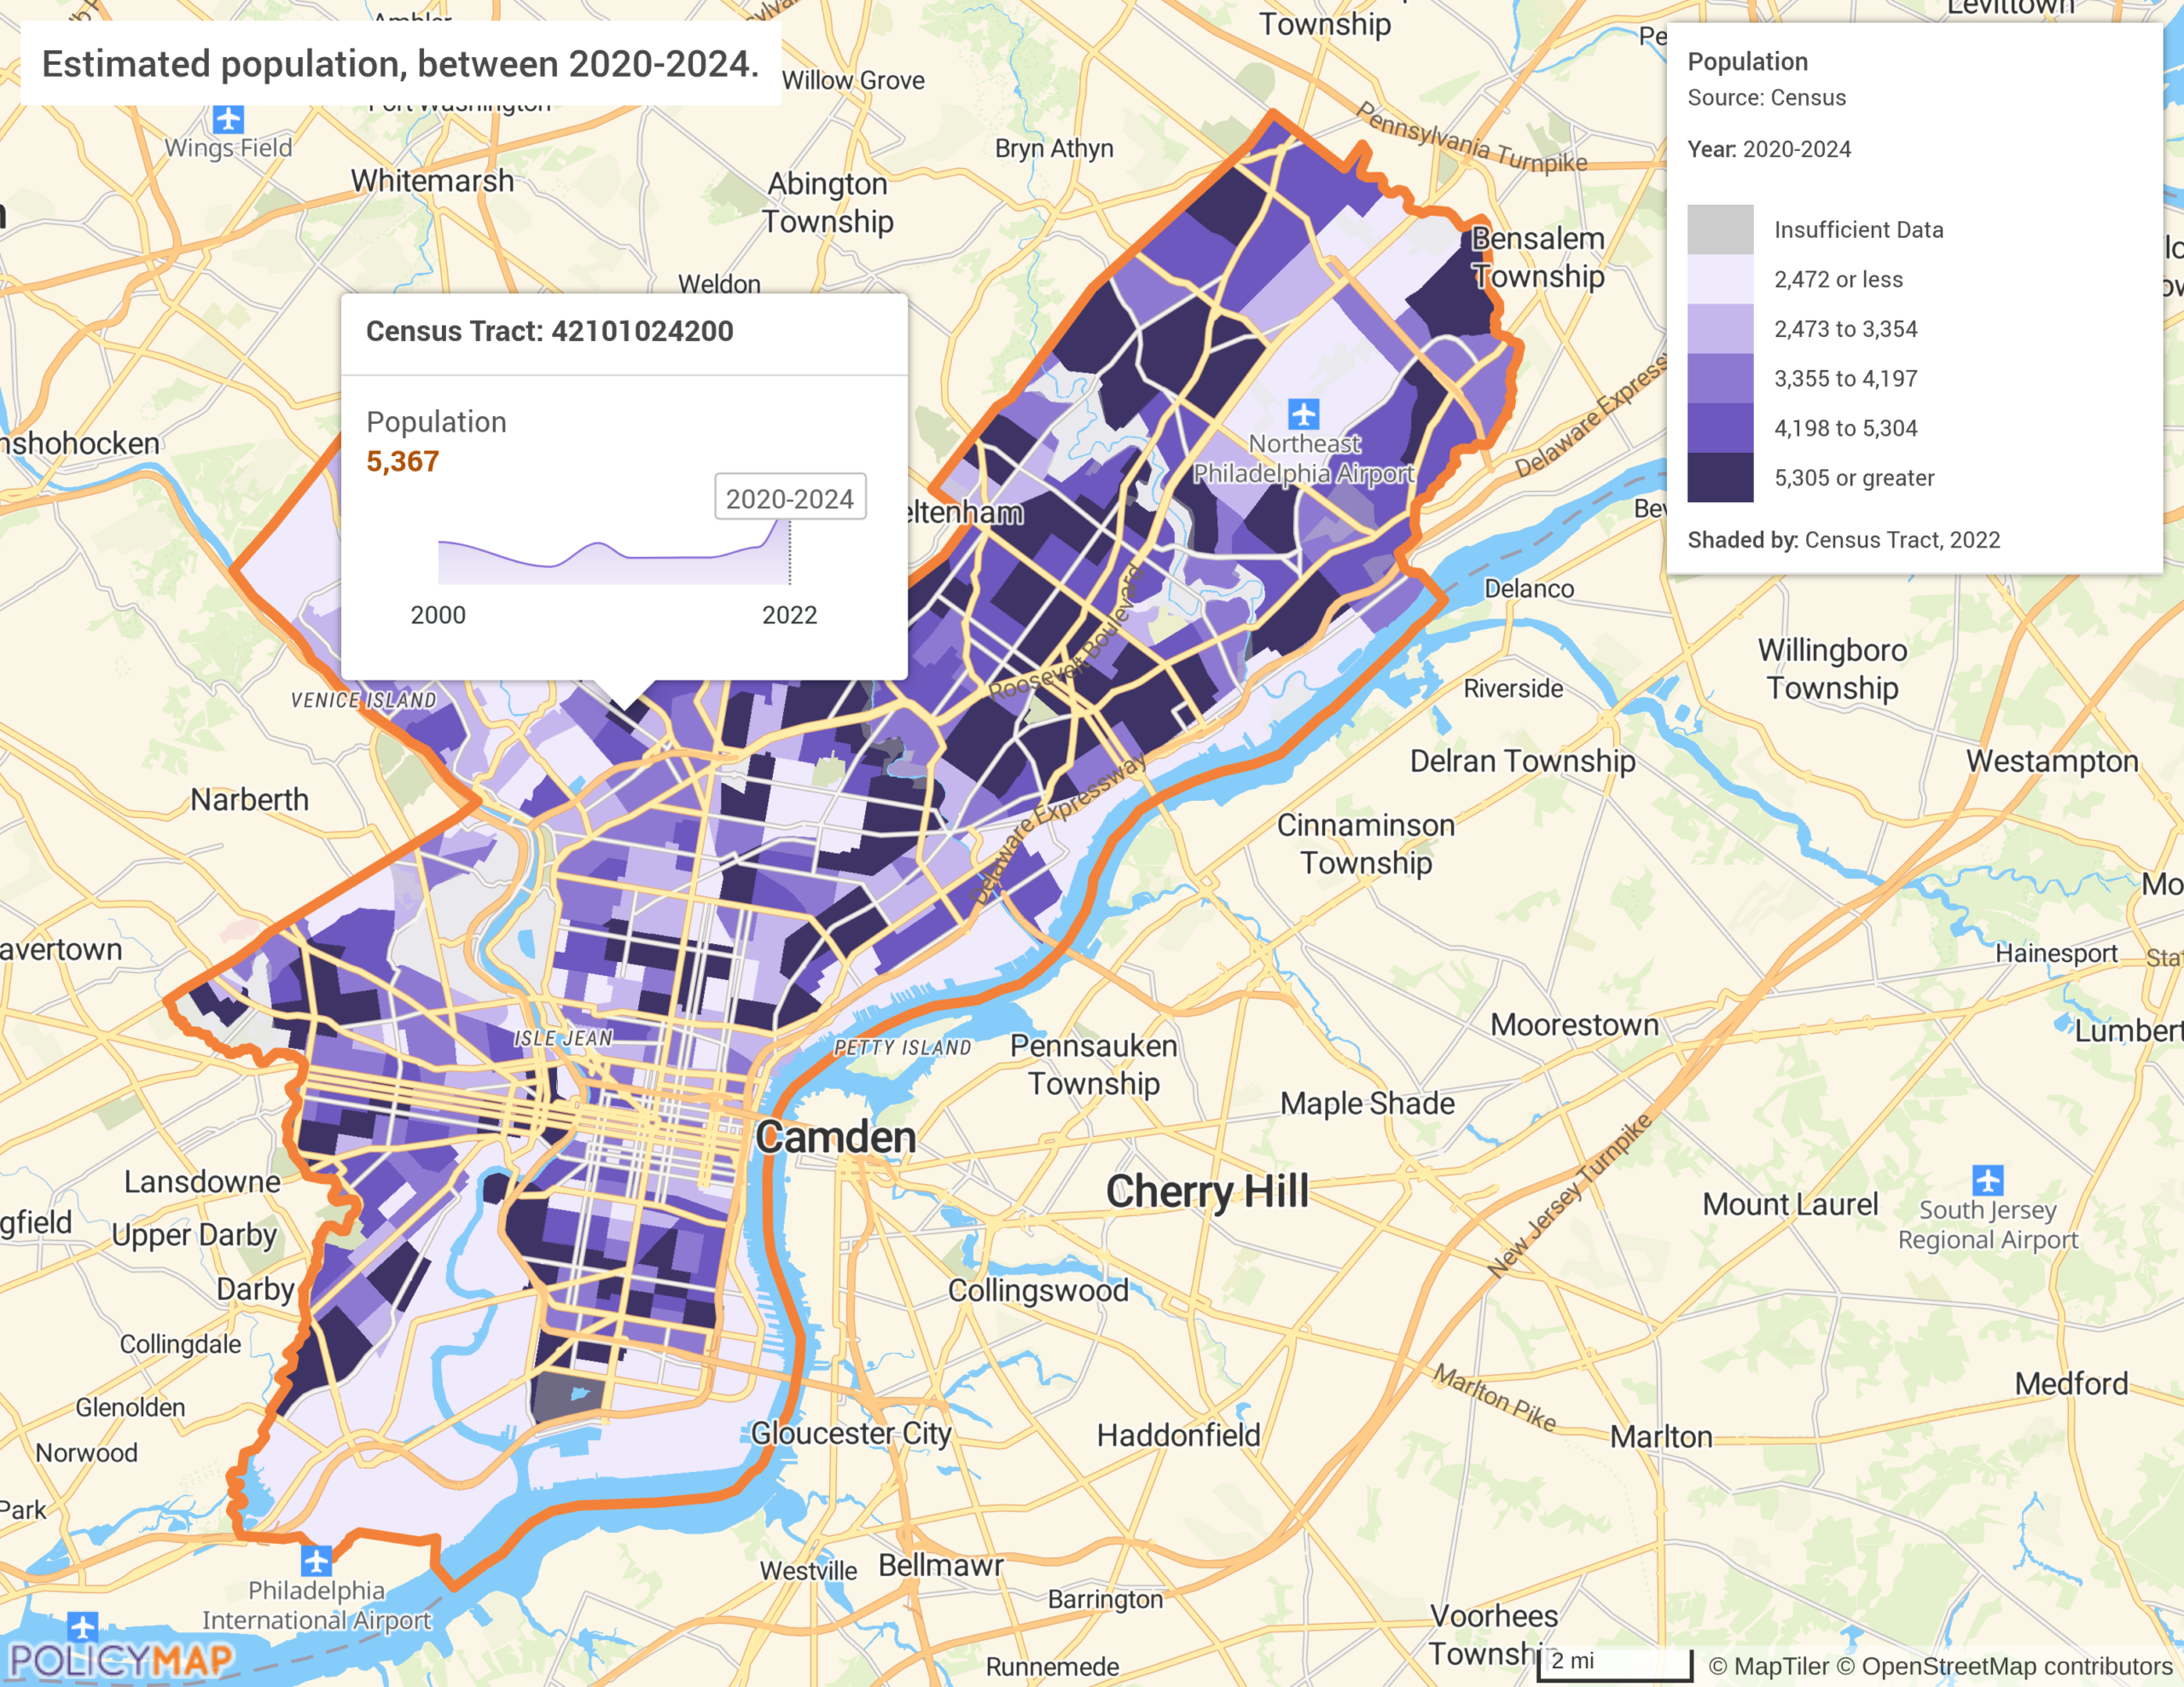
Users can select any Census indicator, enter a location, and instantly visualize demographic trends over the past two decades.
Dive Deeper into Demographics
PolicyMap provides powerful tools to examine demographic trends using key indicators:
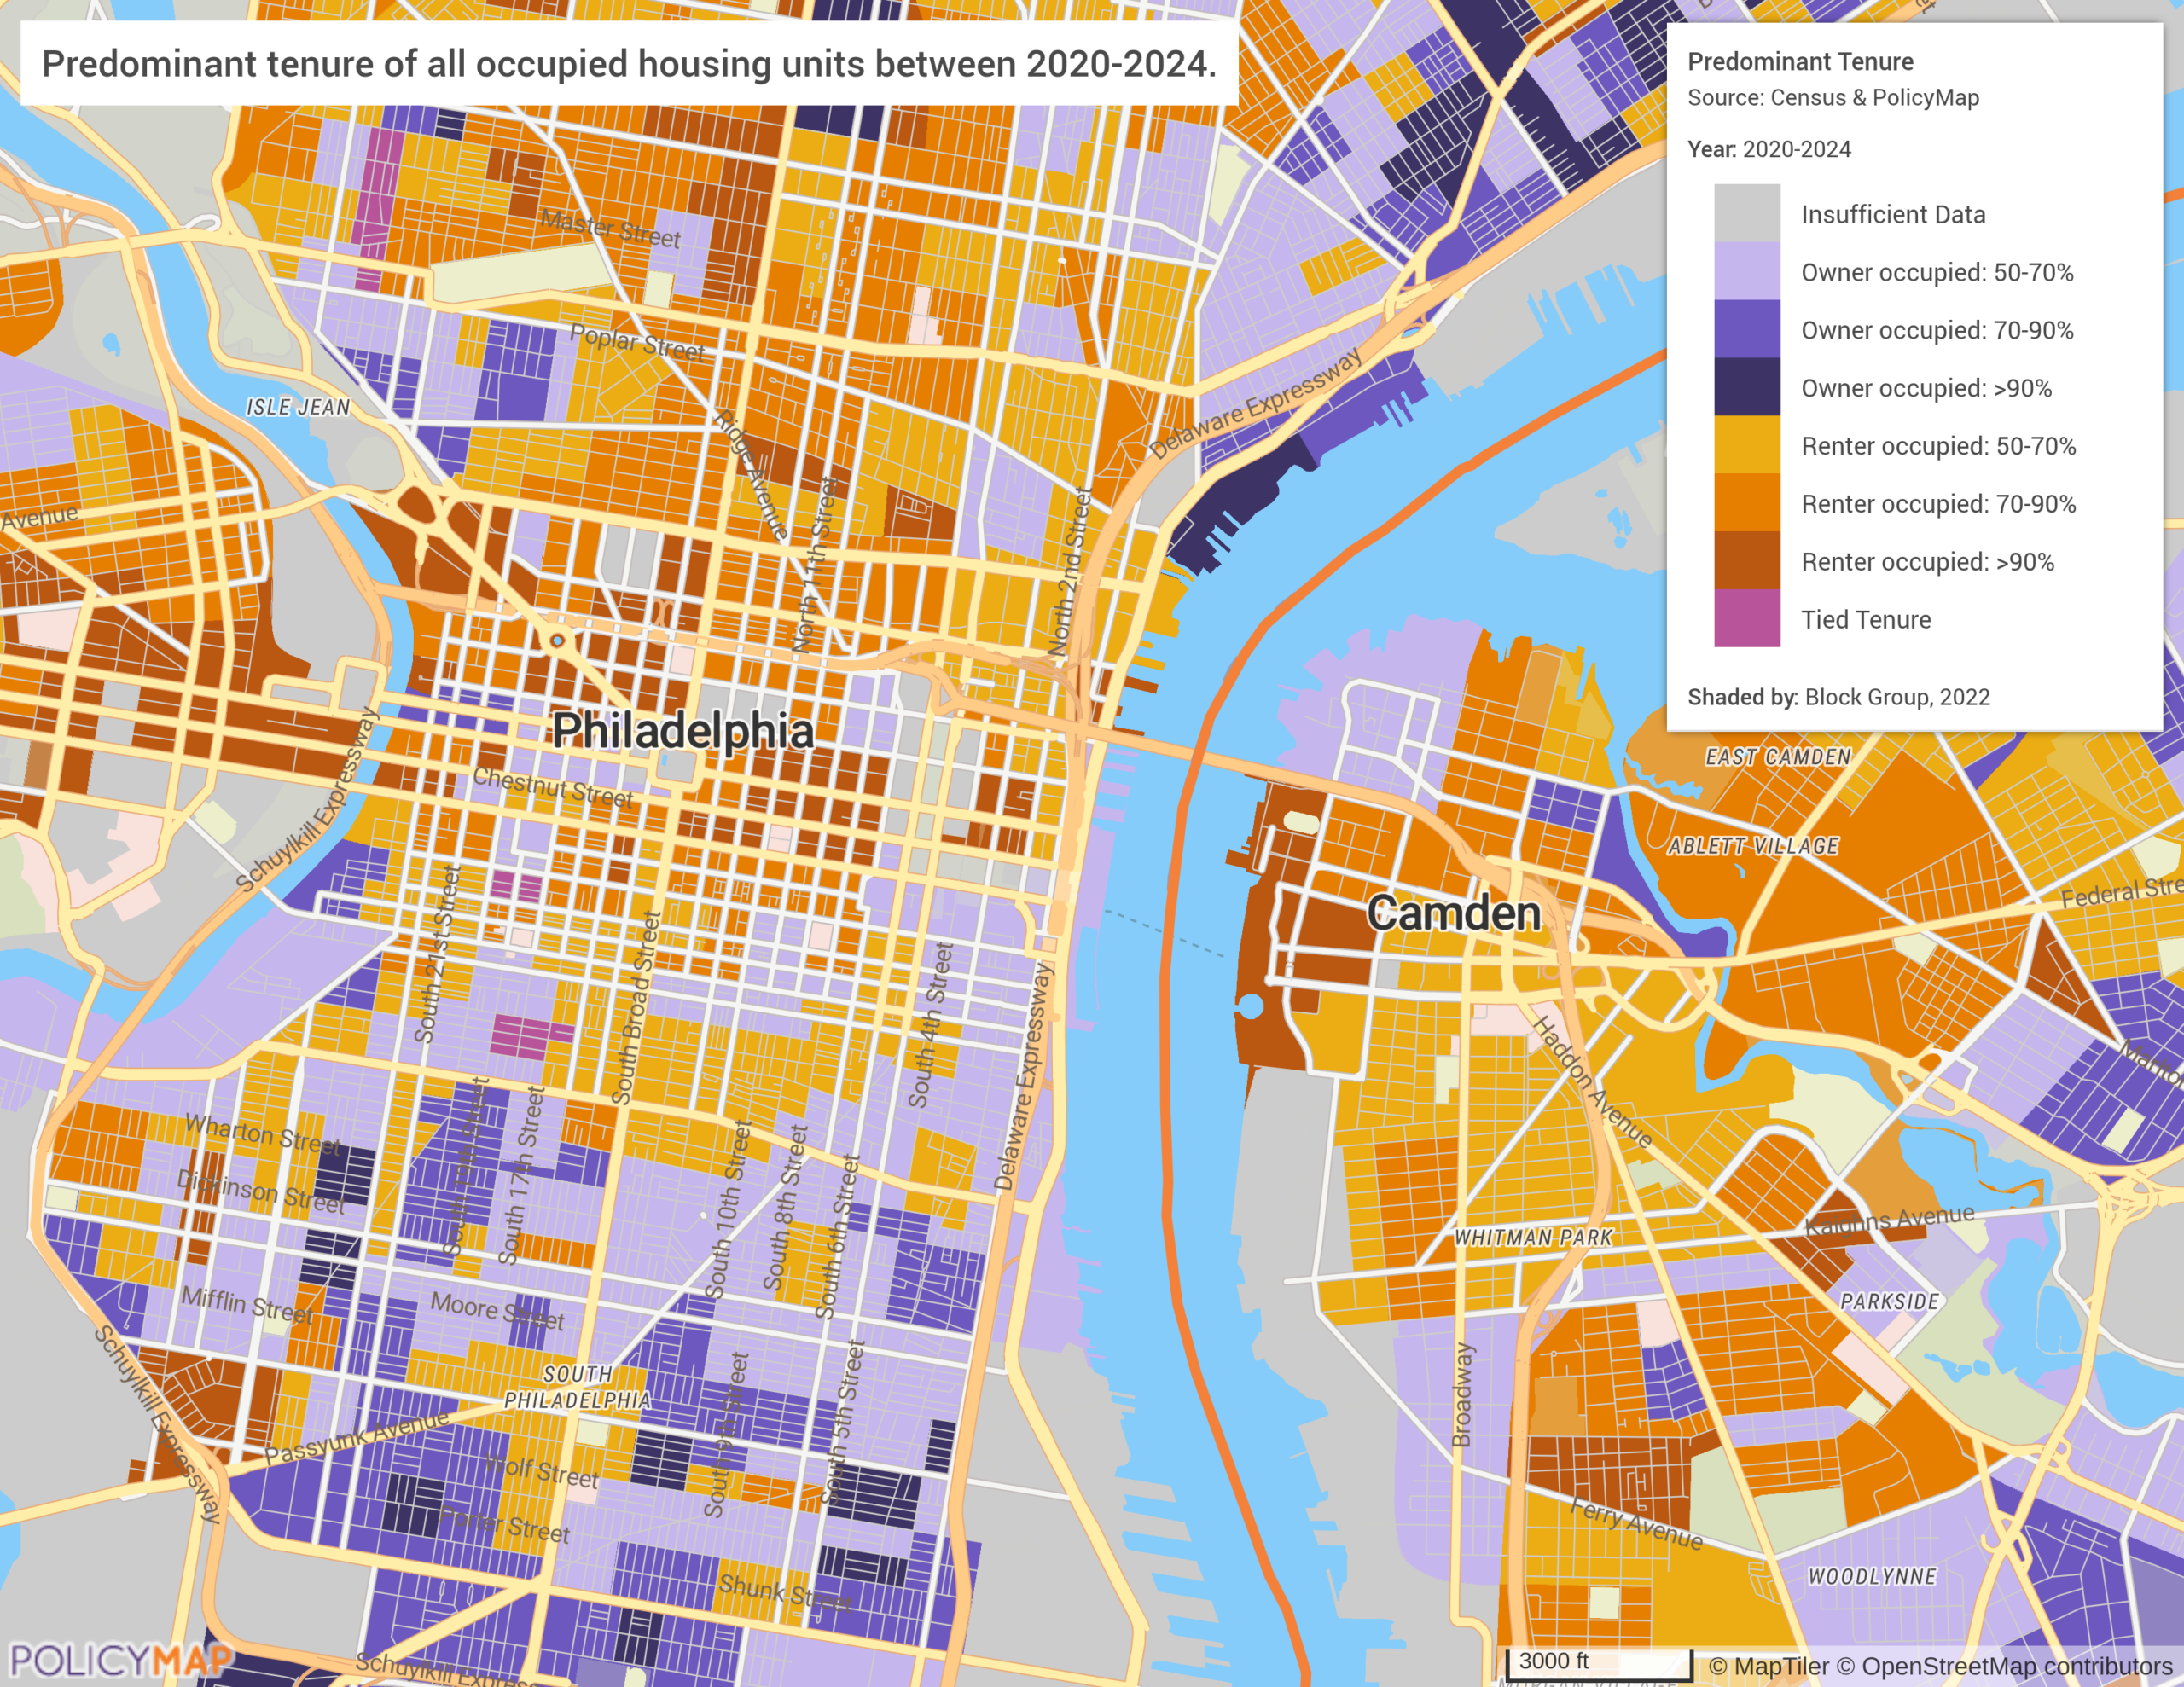
- Predominant Housing Tenure (Owners vs Renters): Displays whether an area is primarily owner- or renter-occupied. Areas where ownership and rental rates are equal are marked as tied.
- Percentile Ranking of the Median Age: Shows how a geography’s median age compares to all similar geographies. A higher percentile typically means a relatively older population; a lower percentile means a relatively younger one.
Together, these indicators offer a snapshot of who lives in an area and how it compares to the broader landscape.
Compare Local Trends with Regional Benchmarks
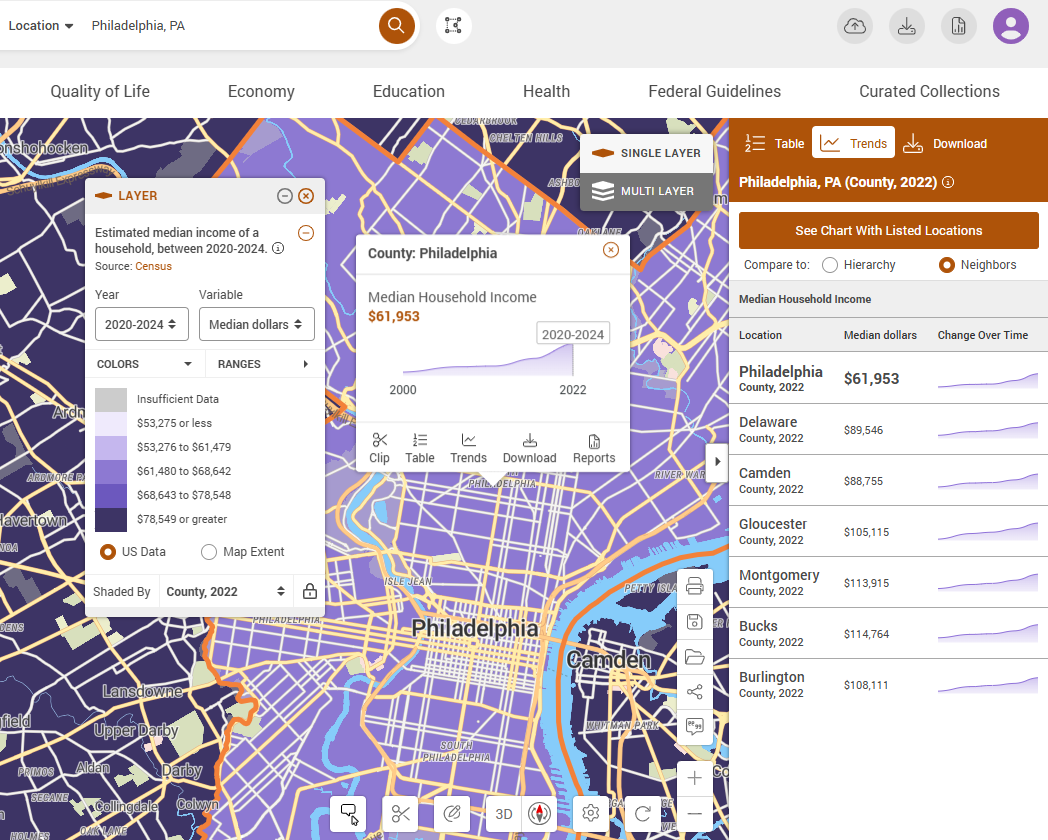
PolicyMap’s Trends feature allows users to benchmark local demographic and economic changes against county, state, and national trends—providing critical context on how an area compares to its broader region.
For example, loading median income data for Philadelphia, PA generates an interactive trend chart revealing income fluctuations and comparison to neighboring counties over time.
Navigating Historical Data with Boundary Updates
Tracking trends over time can be tricky, especially when geographic boundaries shift, or new areas are incorporated. To maintain data continuity, PolicyMap ensures accurate comparisons by bridging boundary changes. When geographic updates impact trend charts, we make adjustments to keep insights clear, meaning trend charts won’t appear if the changes could lead to misleading interpretations. This helps users confidently analyze shifts over time.
What’s New in This Update?
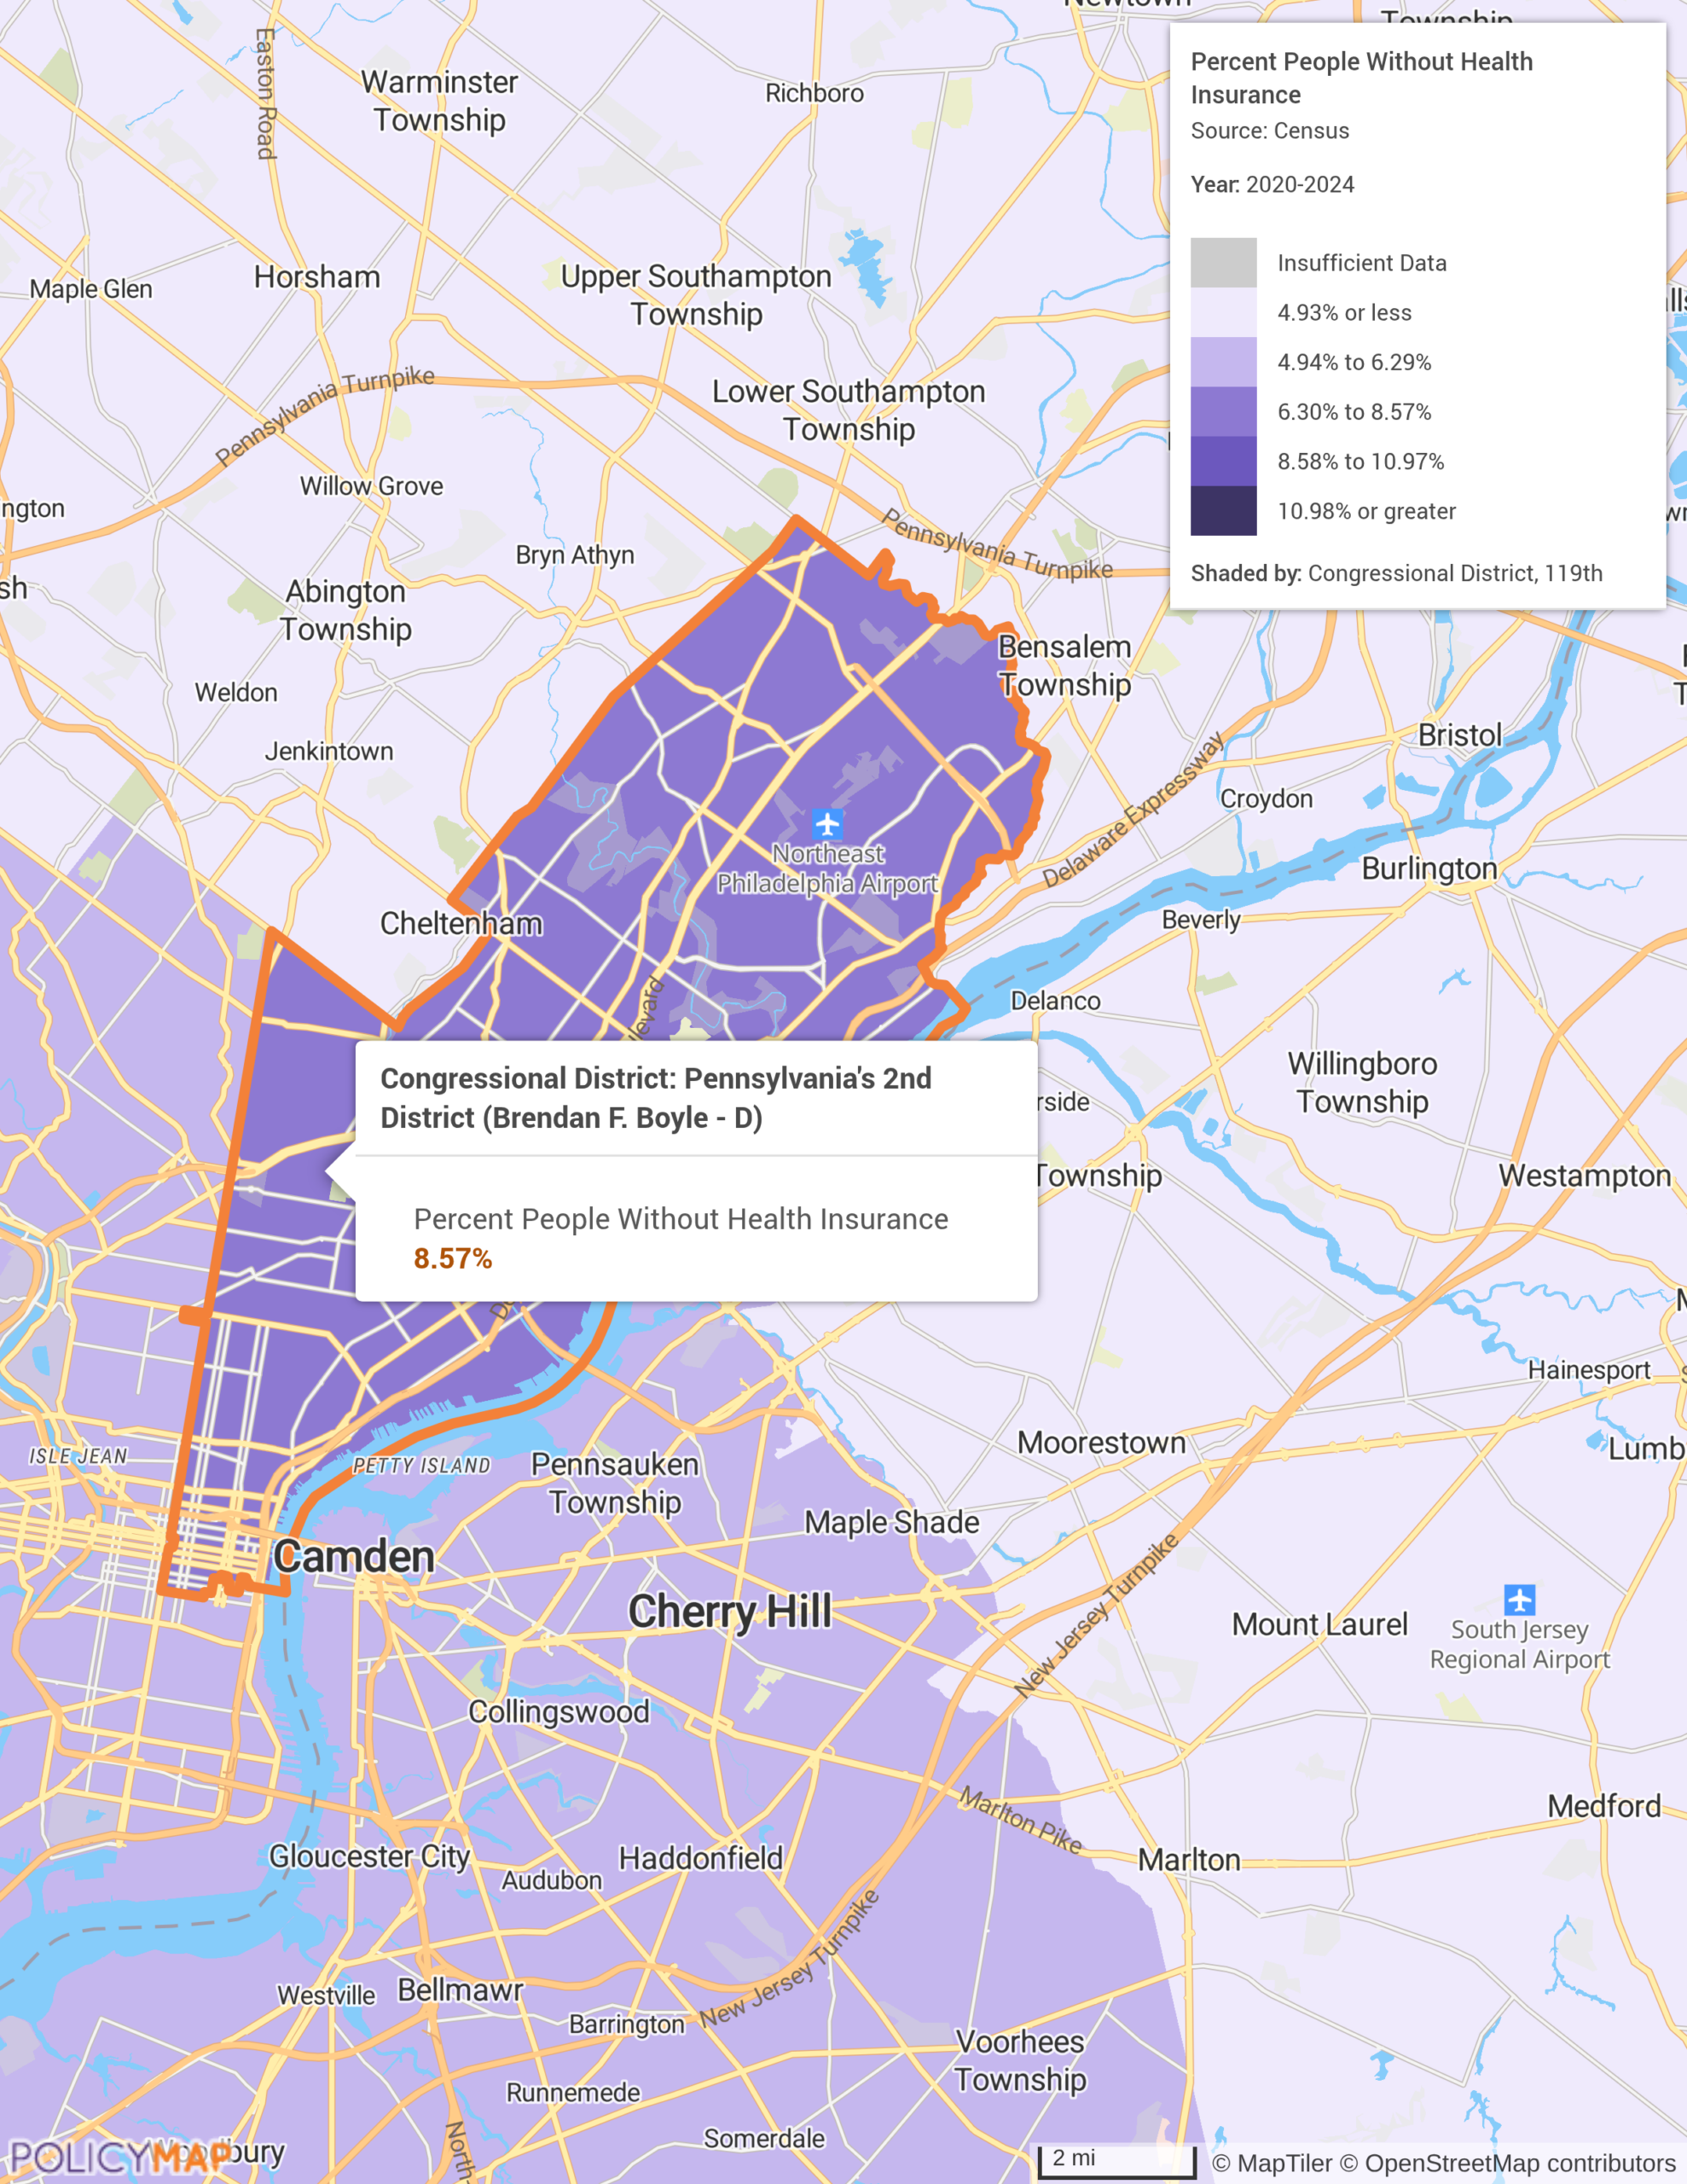
- 119th Congressional District boundaries in effect January 2025 – January 2027 based on post-2020 Census redistricting.
Nationwide Data Access & Upcoming Updates
The ACS is one of the most comprehensive datasets available, covering thousands of topics shaping American society. From economic trends to housing conditions, this wealth of data empowers policymakers, researchers, and everyday users to make informed decisions that drive meaningful change. PolicyMap enables users to create maps, visualize trends, generate Community Profiles, and download ACS and Census data for any U.S. neighborhood, city, county, or region.
Stay tuned as PolicyMap continues to enhance its platform with powerful data and features–sign up for our newsletter, or follow us on LinkedIn, BlueSky, Facebook, or X (formerly Twitter).
Request More Information
From understanding changing population dynamics to pinpointing socioeconomic shifts, the ACS update provides a wealth of information crucial for making data-driven decisions. Ready to learn more about the data in PolicyMap? Request a demo and data walk-through by completing the form below.