
2013Q2 Home Sale Data Now Available
Update (06/09/2021): PolicyMap now has home sale data from Moody’s Analytics. Read more here.
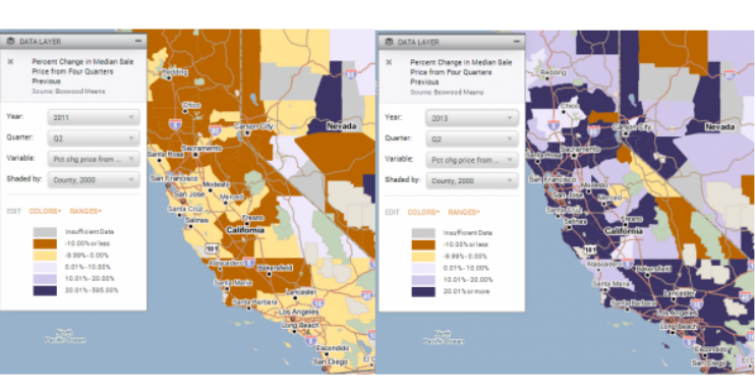
News sources are reporting large-scale increases in home sale prices nationwide. Here at PolicyMap our local home sale data has been updated to 2013Q2. The news is good. Here below you’ll see two maps showing the percent change in median sales price in California counties. The first shows the change from 2010Q2-2011Q2, and the second shows 2012Q2-2013Q2. The maps have identical ranges, allowing you to see that the declines (oranges) from two years ago are now replaced with increases (purples).


Our home sale data comes from Boxwood Means, a re-seller of CoreLogic’s real estate data. PolicyMap’s data is local, allowing you to explore home sale trends not just at the county level, but also at the ZIP code, Census tract, and even block group level.
Also with this update, PolicyMap has refreshed all our home sale data going back to 2007. CoreLogic’s coverage has greatly improved in the last few years, so you’ll find better coverage in our more historical data particularly. Overall you’ll find sales prices are mostly unchanged. However, in some places don’t be surprised to see changes in the numbers of sales reported in some areas.