
Racial and Ethnic Segregation: In the News and On PolicyMap
Residential segregation certainly has been making headlines over the past month. On June 25th, the Supreme Court rejected a challenge to the Fair Housing Act of 1968 in Texas Department of Housing and Community Affairs et al., v. Inclusive Communities Project, Inc. et al., thereby upholding the ability for advocates to quantitatively show that housing practices have a “disparate impact,” even if the original intent of these practices is not discriminatory.
On July 8th, President Obama and HUD Secretary Julian Castro introduced a new rule to “affirmatively further fair housing.” This rule comes after several years in the making and is most notable in that it:
“directs HUD’s program participants to take significant actions to overcome historic patterns of segregation, achieve truly balanced and integrated living patterns, promote fair housing choice, and foster inclusive communities that are free from discrimination” (source: HUD Final Rule).
Both of these rulings attempt to redress and redirect residential patterns of segregation; a widespread by-product of decades of race-based practices such as redlining, contract mortgages, segregated zoning ordinances, and the concentration of tax credits for public and affordable housing in low-income, urban, neighborhoods of color.
The new HUD rule-making also makes clear that a primary aim is to make data-driven analyses and decisions regarding fair housing more accessible. To achieve this goal, HUD is enhancing their existing online interactive mapping tool, where grantees of federal subsidies can assess if housing is, or potentially is not, being allocated in a fair manner across communities.
At the heart of PolicyMap’s work is a similar aim – to provide individuals and organizations the data they need to better understand the social, political, economic and environmental context of life. So, while it was several months in the making, PolicyMap is making a timely release of several indicators that may prove complementary in assessing “disparate impacts” in housing practices.
National Segregation Index
The first is an index of segregation, the Theil Index, which you can find in PolicyMap’s Demographics tab. As best we could determine, the “Theil” in Theil Index is pronounced “tail”, named after Dutch econometrician, Henri Theil. The index is a measure of how evenly members of racial and ethnic groups are distributed within a region.
It’s important to differentiate this index from the Diversity Index, also up on PolicyMap. The Diversity Index comments on the racial make-up of a neighborhood, by conveying the likelihood that two individuals chosen at random would be of different races or ethnicities. The Theil Index, on the other hand, takes the diversity of a neighborhood and compares it to the racial composition of a region.
If all or most neighborhoods within a region are of similar racial compositions as the region, then the Theil index will be fairly low, suggesting that individuals of different races are uniformly distributed (i.e., integrated). Conversely, if neighborhoods within a region exhibit very different racial compositions than the respective region, the Theil Index will be higher, suggesting a higher level of segregation.
Generally, more diverse neighborhoods mean a more integrated city. Though, there are instances where low segregation values may not be indicative of a diverse area. Regions that are highly homogenous may have equally homogenous neighborhoods; thus, leading to low Theil Index values and low diversity values. So, it’s worth taking a closer look at the actual composition of an area to better understand what each index is really suggesting.
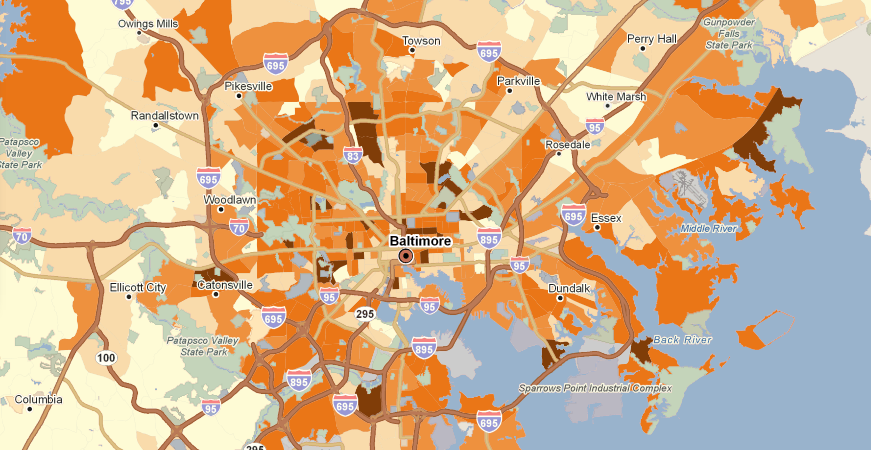
Racially and Ethnically Concentrated Areas of Poverty
In addition to the Theil Index, we’re also releasing a new data layer of Racially and Ethnically Concentrated Areas of Poverty (RCAP/ECAP). This indicator is currently used by HUD as a way to identify Census tracts that have both a high proportion of non-white individuals and people living below the poverty line. HUD currently directs program participants to identify RCAP/ECAP areas in assessments of the barriers to fair and inclusive housing.
On PolicyMap, you’ll find this layer under Federal Guidelines, then Housing and Urban Development and Fair Housing. In that same section, you’ll see some other relevant housing point data that you can overlay with RCAP/ECAP areas; for example, the locations of Low-Income Housing Tax Credits (LIHTC) projects.