
2010 Census Data Has Arrived!
The new 2010 Census Redistricting Data is now available on PolicyMap. As you may recall from our previous blog posts, the American Community Survey (ACS) has taken the place of the Census long form. So now, the data from the 2010 Census comprises what was contained in the short form. What this means is that Census 2010 data includes just a few indicators such as race, ethnicity, and occupied and vacant housing units. You’ll see most of the data in our Demographics tab in the Population, Population Density, Race, and Ethnicity sections.
Due to the growing diversity in the U.S. population, the Census now collects more detailed race categories than ever before. We’ve decided to show some of these new multiracial categories on PolicyMap so that our users can incorporate them into their maps, tables, and reports to show the latest demographic information available.
As you take a look around your neighborhood, you may be wondering why you see some grey areas on the map. This isn’t because the Census didn’t count in these places; it’s because we at PolicyMap haven’t yet transitioned to the new 2010 Census map boundaries. Since so much of our data still relies on the 2000 Census map boundaries, we’re keeping them in PolicyMap for now. For those places that changed significantly in population, we’re showing grey areas on the map for the 2010 Census data since they can’t be accurately reflected in the 2000 boundaries. Once the 2006-2010 ACS data is released, we’ll make the move to the 2010 boundaries, and you’ll be able to see all of the 2010 Census data on PolicyMap. In the meantime, you can visit the Census’ new American Factfinder to download any data you may be missing: http://factfinder2.census.gov/faces/nav/jsf/pages/index.xhtml
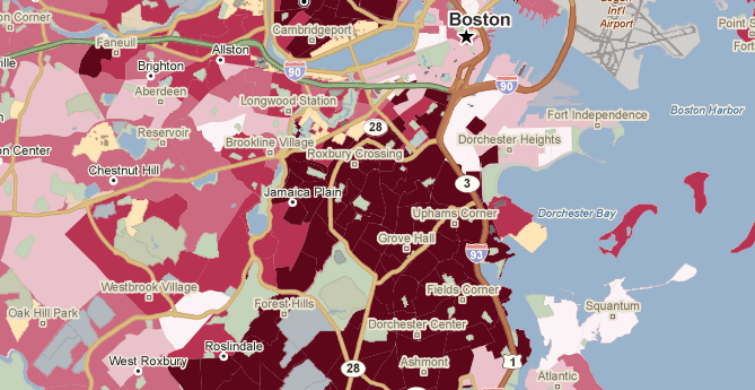
Here’s an example of an interactive map showing African American biracial and multiracial population in Plymouth, MA: