
2013 CRA Small Business and Small Farm Lending Update!
CRA small business and small farm lending data are now updated on PolicyMap with the most recent (2013) data! While the early years following the Community Reinvestment Act (CRA) were focused largely on tracking home lending, over time there has been growing interest in the role of accessible credit in other areas, such as small business and economic development, in revitalizing neighborhoods. As a response to this, 1995 CRA revisions included small business and community development disclosure requirements.
CRA small business and small farm lending data, including breakdowns by loan amount and borrower revenue, are available in PolicyMap’s Lending section. The data are available at the county and tract levels. Every year, we also include data for the top ten leading small business and small farm lenders, though this is only available at the tract level.
The map below shows the number of small business loans in 2013 by county. Understandably, the bulk of small business lending takes places in major metro areas, which have the largest population and highest concentration of small businesses.
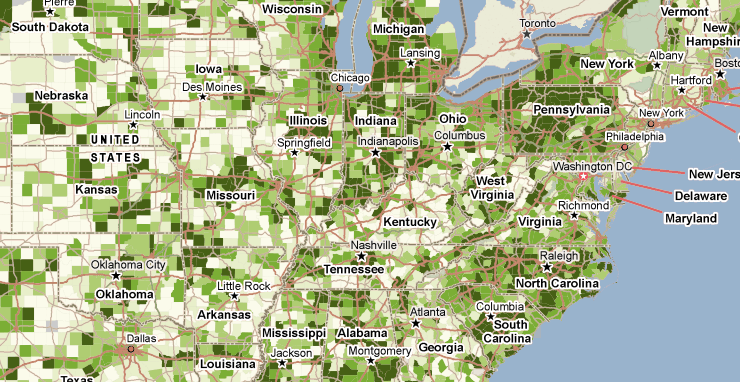
However, when you look at the average dollar amount of small business loans, the loan size tends to be lower in some metro areas and higher in some rural areas, such as in the Midwest.
It is important to keep in mind that the CRA data, released by the Federal Financial Institutions Examination Council (FFIEC), captures only the lending activity of financial institutions with one billion dollars or more in holdings. Thus, it may understate total lending, especially in rural areas in which top lenders may be smaller in size and, thus, not required to report.
Have fun exploring small business and small farm lending in your communities! For more information about the CRA data, visit the FFIEC’s or the National Community Reinvestment Coalition’s website.