
Examining Migration Data in PolicyMap

Data
Net Household Migration
Source
Find on PolicyMap
- Demographics
- Population
- Migration
- Annual Migration
- In-Migration
- Out-Migration
- Net-Migration
The flow of people between places has wide-reaching implications. In the business world, migration is critical to understanding expanding and shrinking markets, areas of job growth and job loss, and potential new business opportunities. For urban and regional planners and policymakers, migration data helps form the basis for assessing future housing needs, projecting future traffic patterns and congestion, and determining how to efficiently manage anticipated growth or decline in a region. On a more basic level, migration information helps us to better understand places – like why certain places are attracting people and others are losing people.
Migration data available in PolicyMap comes from two different sources, which each tell a slightly different story. One shows annual migration patterns, the other shows an overall look at the prevalence of new residents in an area.
Annual migration patterns (in-migration, out-migration, and net-migration) at the county level for households and individuals comes from the IRS Statistics of Income (SOI), which produces annual estimates of migration flows based on where households filed their tax returns.
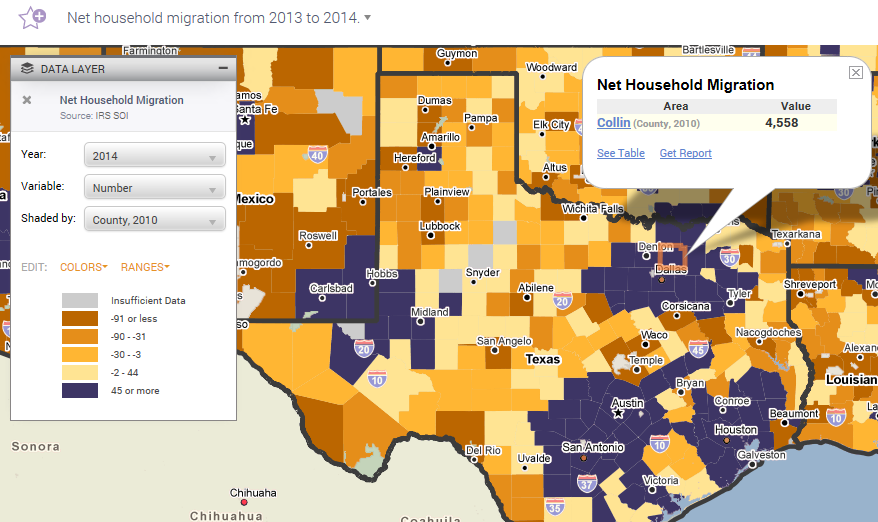
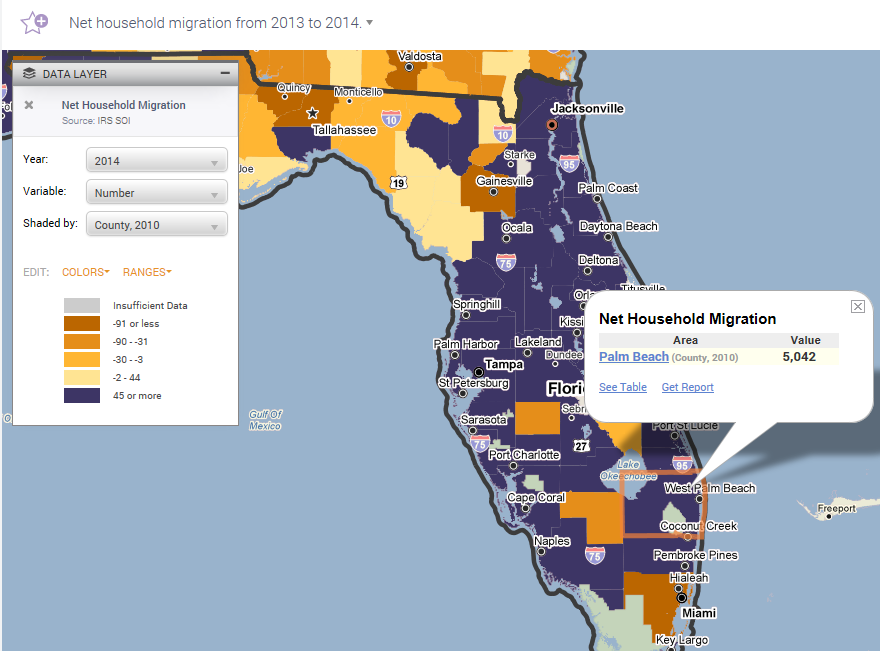
Net Household Migration from 2013 to 2014 (Data Source: IRS SOI)
The second migration dataset in PolicyMap comes from the American Community Survey (ACS) and shows migration by how many residents live in the same state they were born in. This data is based on responses to the ACS question of whether you were born in the state where you currently reside.
So this data will show places where there is a high concentration of either transplants or state natives. Like other ACS datasets in PolicyMap, this information is available at multiple geographic levels (census tract to state level).
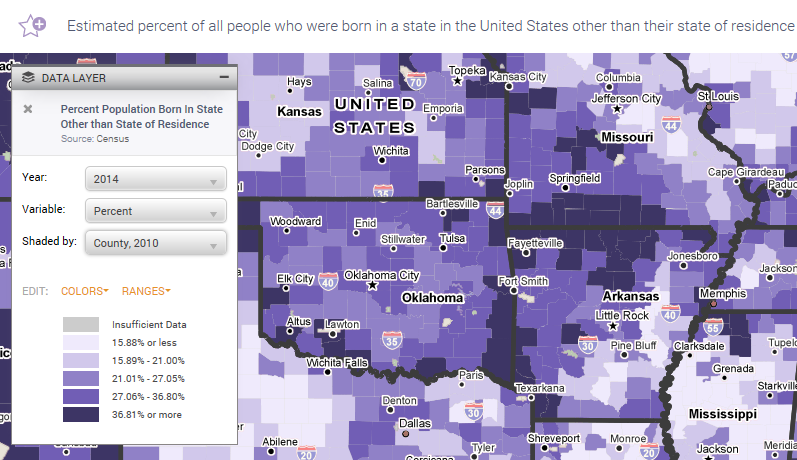
Percent of Population Born in a State Other than their Current State of Residence as of 2010-14 (Data Source: ACS)
Analyzing these two datasets in PolicyMap allows you develop a variety of interesting takeaways. In the annual migration patterns from IRS SOI, positive net migration signals clear growth between 2013 and 2014 in energy production hubs like Texas metros and the Bakken Shale region of North Dakota as well as strong growth in South Florida counties, home to many retirement communities attracting retiring baby-boomers.
Reviewing the ACS migration data by place of birth, there is clearly a higher concentration of transplants in the western states when viewed at the national level. At the state level, there is an interesting trend of counties along state borders demonstrating a higher concentration of transplants relative to the rest of the state. A good example of this is the counties along the borders of Arkansas, Missouri and Oklahoma. These short distance, cross border moves may be to take advantage of more favorable state tax policies or other regulatory considerations or because people may not want to move very far from home.
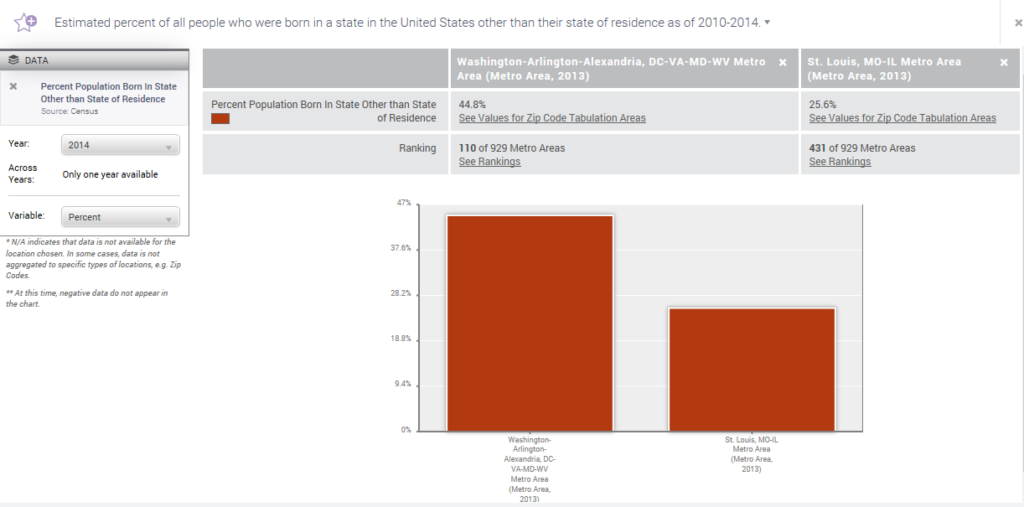
Stark differences can also be observed when comparing different regions like the Washington, D.C., Arlington, Alexandria metropolitan area, where almost 45% of the population was born in a different state, with a region like the St. Louis metro area, where only 25.6% of the population was born in another state.
For more information on state-to-state migration, check out these articles from Forbes, Bloomberg News, Governing, and CityLab.
PolicyMap users can dive deeper into the migration data by searching for it under Demographics > Migration. Both datasets are available to all users.