
3-Layer Maps – Querying Places
In our previous blog post, we introduced the 3-Layer Maps feature and gave some great examples of how it can be used to find and target neighborhoods.
3-Layer Maps gives users the ability to overlay and find the intersection of up to three (3) different data layers. Instead of seeing the mashup of two colors that would represent two data layers, we thought the ability to find how data intersected would be a better way to analyze data. The other great aspect of using 3-Layer Maps is the ability to use any data layer in our library, giving users the option to choose from over 15,000 indicators of data to create unique analysis. We are fortunate that many users have been able to find new and imaginative combination of data layers to intersect.
We wanted to review some of the unique ways subscribers can use 3-Layer Maps.
Sometimes when working with data, you are looking to find places that meet a certain criteria or range of a data layer. 3-Layer Maps can be used to query a data layer to find any location or locations that meets a specific range. For example, do you want to find all the school districts in Oregon that had over 75% of students participating in a Free and Reduce Lunch program? To create this query:
- Go to 3-Layer Maps
- Set Oregon as your location in the search bar
- Load the data under Income & Spending > Additional Income & Spending Data: Free and Reduce Lunch
- In the legend, set the range on the left of the map to 75% to 99.59%
- This will show all school districts that have more than 75% of students in the program
- Select the download icon and choose Download Place, choose Oregon and give the list a custom name
- This will generate a list of the 10 school districts that meet the set threshold. See list of Oregon School Districts

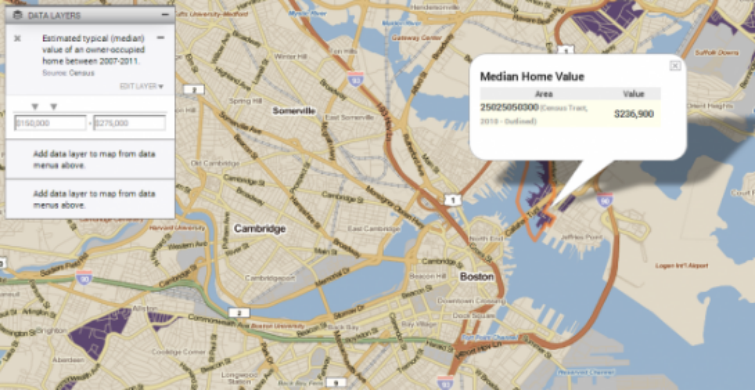
Would you want an example which queries a smaller geography size? How about looking to find tracts that have housing prices within a median home sale range of $150,000 to $275,000 in the Suffolk county Boston area. 3-Layer Maps is a quick way to query and find these tracts. To create this query:
- Go to 3-Layer Maps
- Set Suffolk, MA (county) as your location
- Load the data under Housing > Home Values: Median Values
- Set the median price range to $150,000 and $275,000
- Select the download icon and choose Download Places, select Massachusetts and give the list a custom name
- This will generate a complete list of all census tracts in Massachusetts that meet the range of median home sale price. Home Values in Suffolk County

- Using the FIPS code to identify Suffolk county in the file, you will find the 7 tracts in the county under the FIPS prefix of “250250”
As you can see, 3-Layer Maps can be a very unique tool that allows users to find a list of locations that need to meet just one data indicator.
To read a full guide on all features on PolicyMap, please look at our Primer available here. If you wanted to know more about a feature or topic, send your request to info@policymap.com subject “Tutorial Topics”.