
A Closer Look: Metros with High Performing Schools
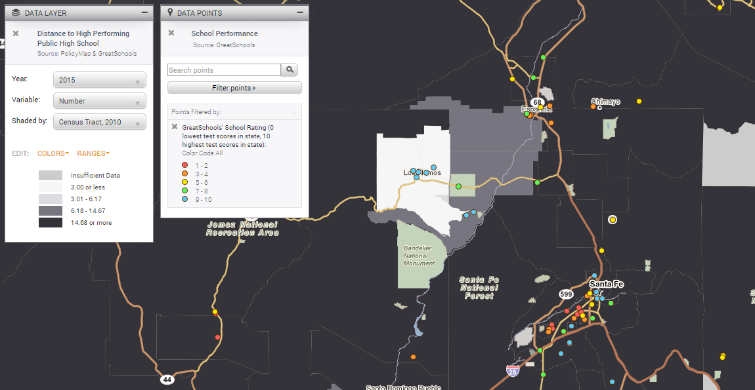
PolicyMap subscribers can now find out how individual public schools around the country rate on a scale of 1 through 10 (with 10 being the highest performance rating and 1 being the lowest).
The availability of this data can help you answer questions about schools in the neighborhoods, cities, metros, or states you care about. As a subscriber, you can find the new GreatSchools Ratings in the Add Sites Menu under “Schools” by clicking on “Schools with Performance Data”. You can then filter all schools by the GreatSchools Rating to find out where the top-rated schools are in your community.
Over the next week or so, we’ll be posting some information that might be of interest to you about where these top-rated schools are located. And, stay tuned for the release of our next education dataset: TRF’s own calculation of neighborhood proximity to high performing schools.
In the meantime, look at the list of metro areas with the highest concentrations of top-rated public schools. We calculated the percent of public schools in each metro area with ratings of 9 or 10 (on a scale of 1 to 10,) out of all public schools in that metro area that received a rating from GreatSchools. The table below shows the metro areas where at least 50% of the schools with GreatSchools Ratings were highly rated public schools. Get this – only 11 metros had public schools where at least 50% were highly rated – the rest falls off below that. And, these metros represent some of the smallest metros in our nation. Is there anything unique about these places? Is there anything particular about neighborhoods, more generally, in which high performing schools are located? Check back for more.
| Metro | Percent of public schools with GreatSchools rating of 9 or 10 | Total Number of Public Schools with Ratings | Number of Children Under 18 (2007) | Percent of Children Attending Public School (2000) |
|---|---|---|---|---|
| Los Alamos, NM | 100% |
7 | 4,162 | 94.15% |
| Lawrenceburg, TN | 92% |
12 | 10,415 | 93.71% |
| Boone, NC | 56% |
11 | 6,146 | 92.72% |
| Spirit Lake, IA | 56% | 9 | 3,193 | 98.55% |
| Fort Walton Beach-Crestview-Destin, FL | 53% | 37 | 46,758 | 92.96% |
| Alamogordo, NM | 50% | 20 | 16,583 | 94.88% |
| Gardnerville Ranchos, NV | 50% | 12 | 9,602 | 94.67% |
| Sidney, OH | 50% | 23 | 13,199 | 90.95% |
| Williston, ND | 50% | 14 | 4,079 | 91.68% |
| Celina, OH | 50% | 16 | 10,805 | 95.94% |
| Martin, TN | 50% | 12 | 6,704 | 97.02% |
*The GreatSchools rating system is based on a score ranging from 1 to 10, with 10 having the highest performance. GreatSchools calculates their GreatSchools’ Overall School Rating by averaging that school’s ratings for all grade/subject combinations. For example, if a state test is given in reading and math in grades 3 through 10, the rating for a school serving grades K-5 would be the average of the ratings for grade 3/math, grade 3/reading, grade 4/math, grade 4/reading, grade 5/math and grade 5/reading. School ratings should not be compared across states, as they are relative to the state in which the school operates. If a given school’s rating is high, that means that its test scores are better than the test scores of most other schools in the state.
For information about tests administered in each state, please see the Data Directory entry for GreatSchools School District Performance.