
A Nationwide Housing Crisis at the Neighborhood Level
With housing costs on the rise, many cities are facing severe affordability challenges, according to “The State of the Nation’s Housing 2019,” a report from the Joint Center for Housing Studies of Harvard University. What are the consequences of these challenges, and how can policymakers respond effectively to them? The report raises issues that impact the whole country, but every city and every neighborhood feels the effects differently.
According to the report, three cities in particular—Austin, Denver, and Dallas—have experienced steep increases in real home prices, as well as the problems that arise as consequences. To analyze these challenges, policymakers can employ data and mapping to identify citywide trends, map neighborhood-level conditions, and spot communities that may need special attention.
Austin
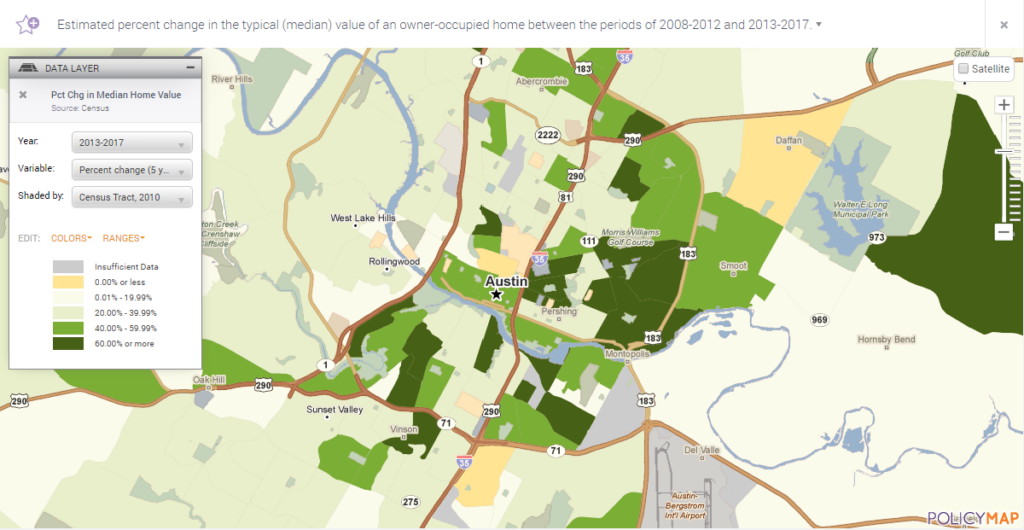
According to the report, Austin has seen a 55% increase in real home prices from 2006-2018. This has hit some neighborhoods particularly hard. Looking at the percent change in the median home value over five years, we can see that home values increased in almost every neighborhood in the city, and that in some areas, home values increase by well over 60%.
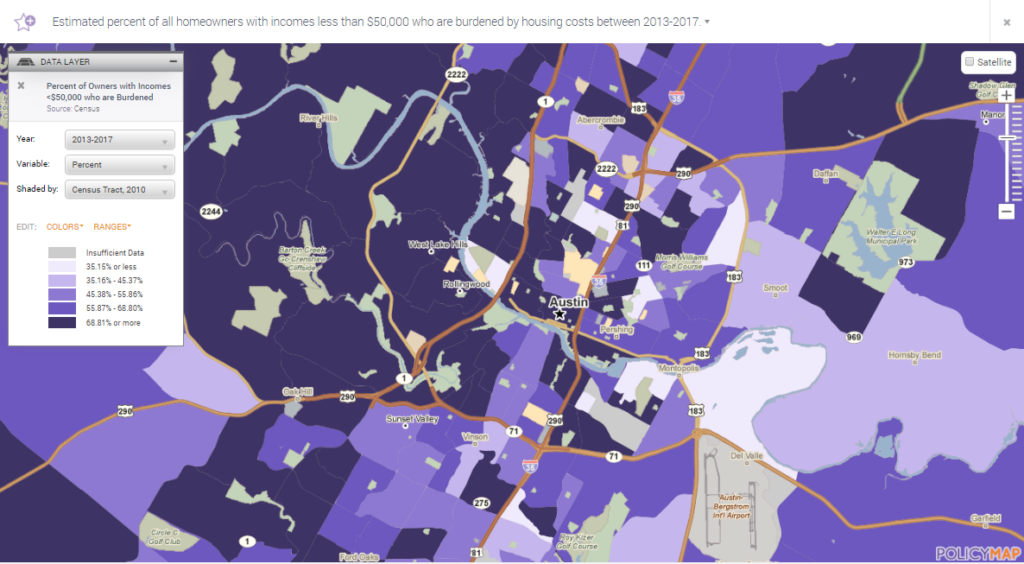
Along with the rising home values, many homeowners in Austin are experiencing high housing cost-burdens, meaning they’re paying more than 30% of their income towards housing. In the Rollingwood neighborhood, for example, among homeowners with incomes of less than $50,000, 72% are cost-burdened. In the map below, you can see how cost-burden rates are high through much of the city.
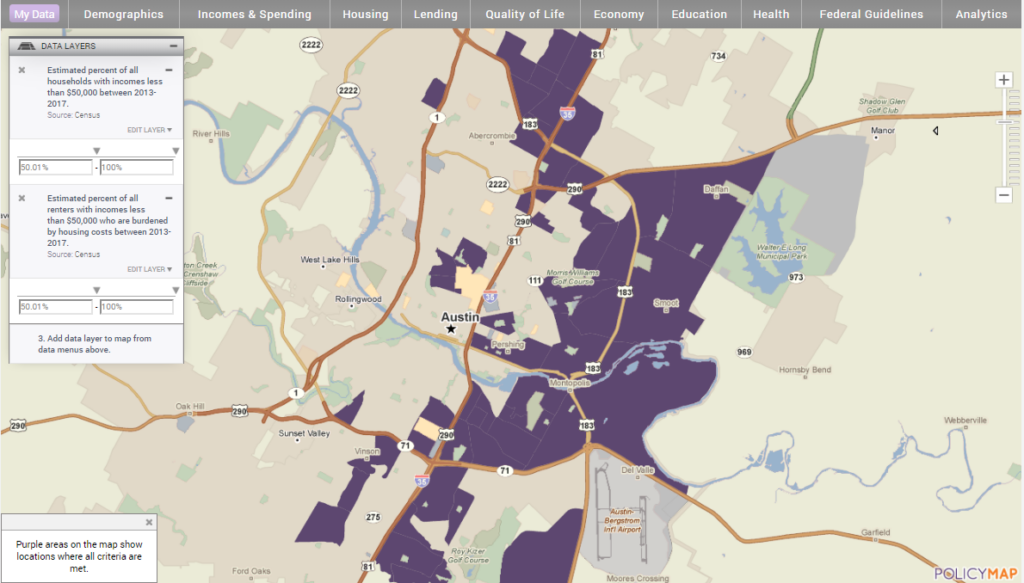
To find the neighborhoods most affected by burdensome housing costs, let’s look at areas where more than half of households earn less than $50,000 per year, and more than half of homeowners earning less than $50,000 are cost-burdened. This can help policymakers target solutions to the populations that are most affected.

Additionally, the report mentions how renters are more heavily affected by high cost-burden rates than homeowners. In Austin, you can see that there are significantly more neighborhoods where more than half of households earn less than $50,000 per year, and more than half of renters earning less than $50,000 are cost-burdened.
Denver
Denver, which has seen a 54% increase in real home prices according to the report, is also experiencing affordability challenges.
One of the causes of the lack of affordable housing that the report mentions is the supply of new housing not keeping up with demand. In the map below, we can see neighborhoods where less than five percent of the housing was built since 2000, even though the population has increased by more than ten percent since then.
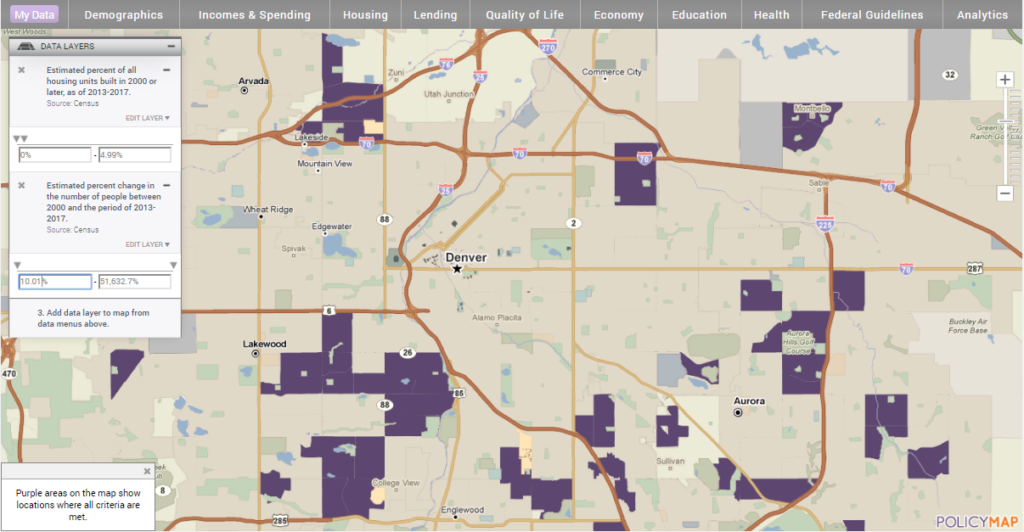
Using this map, we can identify neighborhoods where more housing may be needed due to a recent rise in population.
Dallas
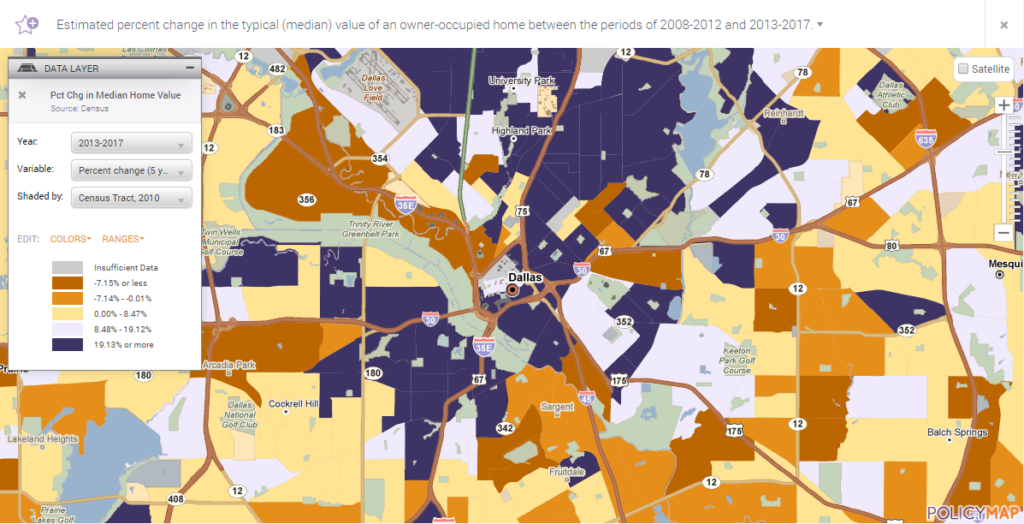
While Austin and Denver have fairly straightforward upward home sale price trends, Dallas is not so simple. Although home values in Dallas have increased an estimated 19.1% over five years, there are many neighborhoods where estimated median home values have gone down. In the area near Arcadia Park, for example, the estimated median home value fell by 17.7%. These decreases, however, are side-by-side with even larger increases elsewhere. An area located in the center of Dallas, for example, has had home values increase by 88.66%.
According to the Harvard report, one of the major consequences of rising housing costs is that as more households are cost-burdened, they have less income left to spend on other necessities like food. Therefore, policymakers might want to consider where housing cost burdens are compounded by the difficulties of lacking local food access.
However, when looking at housing cost-burden rates in Dallas, we see perhaps an unexpected trend when we connect homeowners’ cost-burden rates and areas with limited supermarket access (outlined in blue).
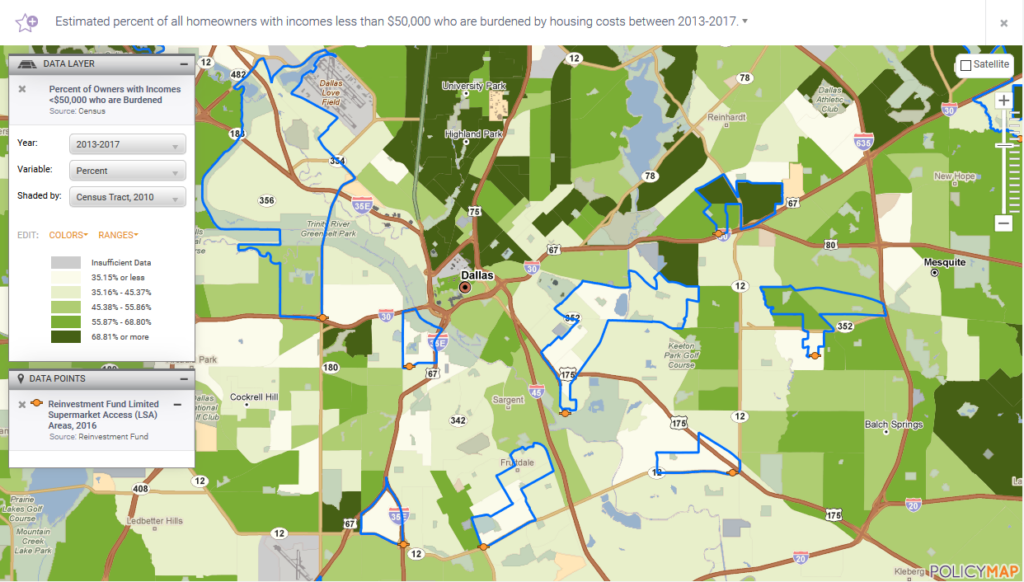
While we may expect to see Limited Supermarket Access (LSA) areas where homeowners have high cost-burden rates, we actually see many LSA areas where cost-burden rates are relatively low. Only one area of low food access is particularly cost-burdened: an LSA area northeast of the center of Dallas has a cost-burden rate of 80.23%.
This tells two important stories: The first is that there are a number of neighborhoods in Dallas where households aren’t cost-burdened by housing, and would likely support a local supermarket. The second is that there are neighborhoods that are hit doubly – with high housing costs and without access to a local supermarket. These separate cases call for distinct solutions, and it’s important to know the difference.
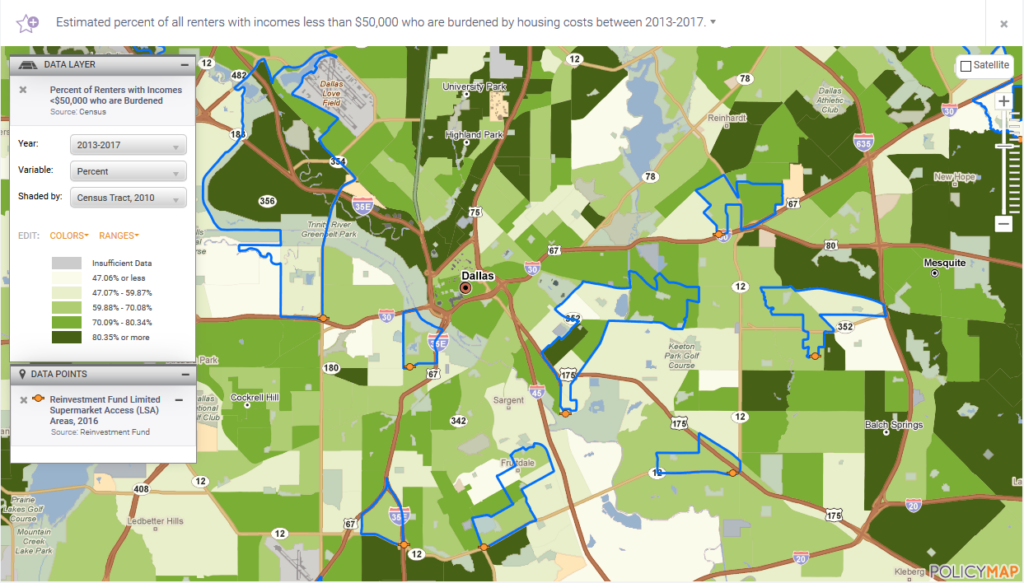
But that’s not the whole story. When we look at the cost-burden rates of renters, rather than owners, we do see more of a correlation with LSA areas. Here, we see a lot more LSA areas where a high number of renters earning less than $50,000 a year are cost-burdened. This tells us that renter households may need particular consideration when policymakers are trying to address food-insecurity.
Although the report highlights affordability challenges in these three cities, similar problems plague metro areas throughout the country. Because every city has its own unique conditions, it’s important to consult data like we’ve looked at here to know the extent of the affordability crisis in your area, what particular neighborhoods are most affected, and what other issues may be compounded.