
A Primer on Low-Mod
From time to time we get a question from a user looking for “low mod” data, wondering if we have it and where it lives on PolicyMap. Each time it sparks some discussion (among the data team here as well!) so we thought we would put together a primer here on the blog.
Low mod refers to ‘low and moderate’ income areas, a concept that as you might imagine continues to be the subject of some debate. What makes an area low- or moderate- income? Does moderate-income fall below some dollar threshold? And low-income below some other threshold under that? And if so, how do you figure out what that threshold is?
The standard approach in calculating low mod is to take the median income of a neighborhood (measured using a census tract or block group) and then to compare it to the median income of the metropolitan area as a whole. The reasoning here is that salaries and cost of living vary substantially throughout the country and this approach gives you a benchmark against which to compare. When a neighborhood falls outside of a metro, the standard practice is to compare neighborhood income to the average income in the state, or to the average income of all non-metro areas in that state.
Once you have done this calculation, the next step is to set your low and moderate income ceiling. Take, for example, a neighborhood that gets a 50% for low mod – meaning the neighborhood median income is roughly half the average median income in the metro area or state. How do we decide if this neighborhood is low- or moderate-income?
The most common convention we have seen is to define neighborhoods less than or equal to 50% as low-income. Neighborhoods less than or equal to 80% are low- and moderate-income. Additionally, neighborhoods with incomes greater than 80% and less than or equal to 120% of the metro or state are often called “middle-income”.
On PolicyMap, you will find low mod calculations in three different places.
First, under the Incomes & Spending > Additional Data > Low Mod you will find PolicyMap’s calculation using our most recently updated ACS data. There are two datasets here to choose from. One does the calculation comparing local to metro/state using median household income. The second relies on median family income. PolicyMap subscribers can set the breakpoints to be at whatever threshold is appropriate. The advantage to this low mod is that it is regularly updated using the most current data available.
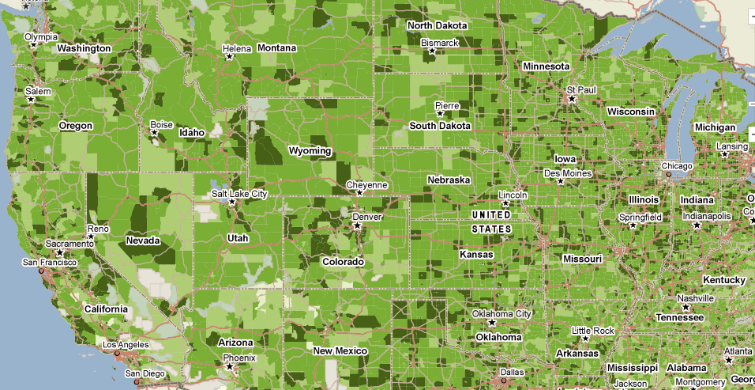
The other two low mod calculations available on PolicyMap are program specific – one is the U.S. Department of Housing and Urban Development’s (HUD) low mod, used principally for the Community Development Block Grant (CDBG) program. This low mod lives under Federal Guidelines > Housing and Urban Development > Community Development Block Grant (CDBG) Eligibility. Here you can display “Very Low Income Persons”, “Low Income Persons” and “Low Mod Persons”, according to HUD’s specifications. To determine quickly whether an area qualifies for CDBG you can also load the “CDBG Eligibility” data layer shown below. This map displays neighborhoods that are low mod as well as the exception grantees that HUD publishes annually, which are also eligible. For more information see our data directory.
The third low mod calculation we have available comes from the Federal Financial Institutions Examination Council (FFIEC) and is used principally for organizations looking into eligibility under the Community Reinvestment Act (CRA). The CRA evaluation looks at bank activity in low- and moderate-income neighborhoods, nonmetropolitan distressed and underserved areas, and federally designated disaster areas. This dataset is annually updated on PolicyMap with latest data. We have the FFIEC’s “Tract MFI %” low mod dataset available under Federal Guidelines > Additional Federal Guidelines Data > CRA Eligibility. You can also load on the CRA Eligibility layer (shown below), which features the Middle Income Distressed and Underserved tracts that are also eligible. For more information see our data directory.