
ACS 2011-2015 On PolicyMap
The Census’s American Community Survey (ACS) is the most-used data source on PolicyMap. Every year, from the moment its annual data is released in early December, we work around the clock to process the data and get it up for you to use. Because it involves over 2,000 individual indicators and just as many twists and turns, the process usually takes us three to five months to complete.
Well, Merry Christmas, Happy Hannukah, and Smokin’ Solstice, because this year, we got ACS up for you in under a month! As is always the case, new ACS data brings new goodies, and here’s a rundown of what we’ve got (and in case you missed last year’s bundle, read that post here):
Latest Data
The most important thing about the annual update is that the data is a year more up to date. It’s now the five year range of 2011-2015.
New Indicators
Every year, we like to add some new indicators that haven’t been on PolicyMap before. This year’s highlights include:
- Language spoken at home (for 41 different languages – Demographics, Language)
- Limited English-speakers by language spoken at home (Demographics, Family Type)
- Families with Children (Demographics, Family Type)
- Grandchildren living with grandparents (Demographics, Household Type)
- Adopted children and foster children (Demographics, Family Type)
- Three new Asian race categories: Pakistani, Taiwanese, and Bangladeshi (Demographics, Race, Asian)
- Households moved in since 2010 (Housing, Household Turnover)
- More coming (stay tuned)
Five-Year Percent Changes
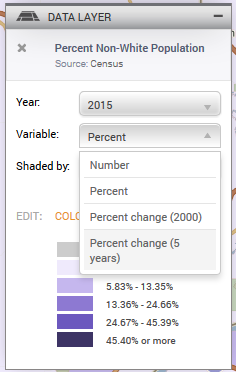
ACS five-year estimates can be compared over time with non-overlapping time periods. Last year was the first year non-overlapping data existed (2005-2009 and 2010-2014), but the difference in boundaries between the two didn’t allow for easy comparisons. This year, the new 2011-2015 data can be compared with the 2006-2010 data, which is (generally) at the same boundaries. So if you load an indicator that existed in 2006-2010, you can now go to the “Variable” drop-down menu in the legend, and choose “Percent change (5 year)”. For many indicators, you’ll have the choice of a percent change from 2006-2010 OR the 2000 Census.
We still have the 2005-2009 data available in the Year menu, but that will change to 2006-2010 in the coming months.
How We Did It
Since processing ACS has taken us months in the past, and is now taking us a couple weeks, what are we doing differently this time?
The biggest factor is it’s our seventh time processing ACS. We’ve done this before, and have the experience to get it done quickly.
We spent months in advance of the ACS release preparing. We streamlined our processes, inputted the specifications for new indicators (including all the new percent changes), wrote metadata for the new indicators, and did pretty much everything we possibly could do without having the data in hand. We also blocked out the day of and weeks after the release to dedicate to its processing.
Once the data was released, we worked non-stop, overnight, through the weekends to yell at our SQL server to run faster. The release had some surprising changes to some tables we had to account for (such as the indicator for people who moved into their homes since 2010 being split into 2010-2014 and 2015 or later), so one cold Sunday was spent inside the office making that work (it’s good the ACS doesn’t come out during biking season).
What we didn’t do was skimp on data validation. In addition to checking new indicators by hand, we developed new automatic mechanisms for comparing the new ACS data to last years, and spotting unexpected differences.
Over the next few weeks, we’ll be posting more about what’s new and useful in the data. But for now, enjoy the latest available data from the ACS, and happy New Year to all.