
ACS 5-Year Estimates Include New Race & Ethnicity Indicators

The latest American Community Survey (ACS) 2015-2019 5-year estimates are now available on PolicyMap. The Census Bureau releases new ACS data every year in December, providing recent estimates for the previous five years. This year PolicyMap added several new variables, specifically, Race/Ethnicity indicators, which show a more granular view of our diversifying population.
Users can now access demographic information for a wider variety of racial groups and ethnicities and observe percent change over time. For example, on PolicyMap, now you can look at Hispanic or Latino ethnicity broken down by race, such as in the map of American Indian or Alaska Native Hispanic people below.
You can also see groups of people who identify as a particular race and do not identify as Hispanic or Latino, as in the Native Hawaiian and Other Pacific Islander and non-Hispanic maps below.
The five-year changes (2010-2014 to 2015-2019) detail each group’s increase or decrease in specific geographies. The map below shows how the percentage of people in the Washington DC area who identify as Non-Hispanic Black or African American has changed over the course of five years.
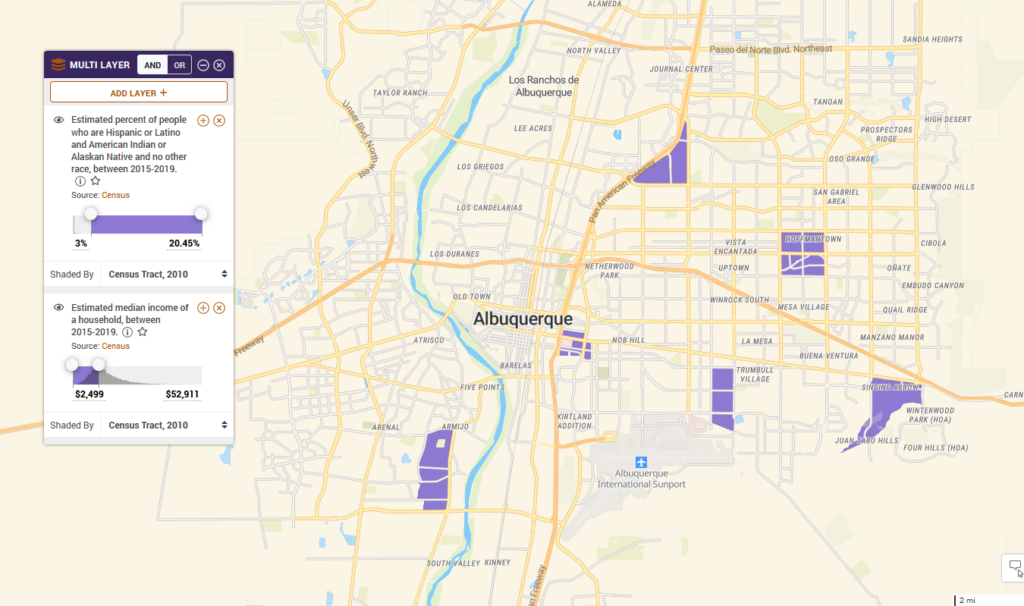
Lastly, check out the ‘Multi-Layer’ feature on PolicyMap to better understand individual communities by adding household incomes or home mortgages combined with new demographic indicators. The following map shows areas where median household income is below the median ($52,911), and the percentage of people who identify as Hispanic or Latino and American Indian or Alaska Native is above 3% near Albuquerque, NM.
Additional Indicators
You can also find other new indicators to PolicyMap, for example, children aged 5-17, people born in Micronesia, occupied and vacant rental units, and more under our Demographics, Income & Spending, and Housing tabs.
Changing Census definitions of Race and Ethnicity
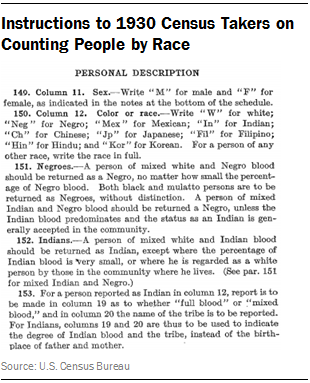
Before 1960, individuals could not select their own race on the Census questionnaire but were instead identified by enumerators under strict classification guidelines. The Census continues to update how they ask and define race and ethnic categories. In 1996, they only allowed people to select ‘Spanish/Hispanic/Latino’; now, individuals can specify their origins like Argentinian, Colombian, Dominican, Mexican, Cuban, etc. Currently, Hispanic or Latino is considered an “ethnicity” rather than a race, meaning that a person notes on the questionnaire whether they identify as Hispanic or Latino and what race they consider themselves.
Today, the Census reflects a social definition of race, rather than biologically, anthropologically, or genetically, which we saw in earlier iterations of the Census. In addition to race and ethnicity, the Census questionnaire includes racial and national origin or sociocultural groups. For example, the Census determines that Black or African American means having origins in Africa’s Black racial groups. Similarly, white encompasses the original people of Europe, the Middle East, or North Africa. Other racial groups follow a similar pattern of having origins in specific continents or regions of the globe. Ultimately, each designation is self-selected and depends on how an individual identifies.
Take a look at the new additions to our menu under the Demographics tab.