
ACS Data Comes in Five-Year Ranges, Legend Has It
When we added the 2005-2009 data from the new American Community Survey (ACS), it was the first five-year estimate data that we’d made available. Unlike data from the Decennial Census, which is all collected over the course of a single year, the ACS includes data from five years of surveys in order to accumulate a large enough sample size to aggregate to small geographies, like census tracts.
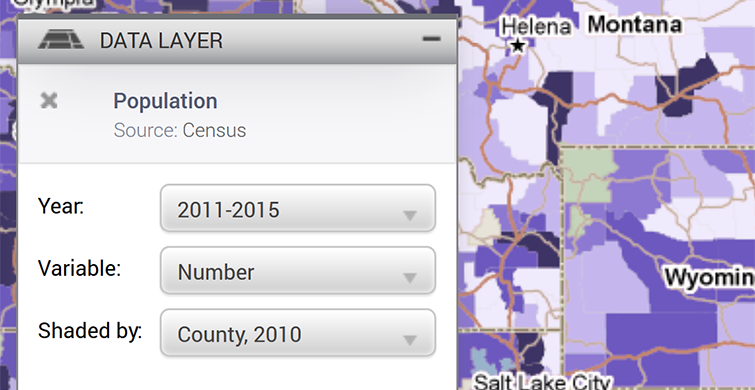
In our map legends, we simply displayed the latest year in the range, which was consistent with the shorthand the Census uses on platforms like Census FactFinder. And in our metadata, the labels you see above the map, we were clear about the data coming from a five-year range of time.
But we still wanted to make it clearer by showing the whole range in the legend, not just the latest year. And, to press the issue further, we show Decennial Census data from 2000 and 2010 in the same data layer as ACS data. This left us unable to show 2006-2010 ACS data (labeled as “2010”) at the same time as 2010 Census data.
And so, we present to you, without further ado, five-year ranges in the legend:
With these five-year ranges, we can also now provide 2006-2010 ACS data that you can compare to the latest 2011-2015 data. (The Census advises against comparing ACS estimates with overlapping ranges, which is why last year’s data – the 2010-2014 estimates – were the first we were able to compare to previous estimates, the inaugural 2005-2009 data.)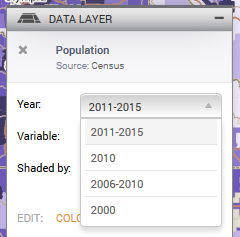
When we released the 2011-2015 ACS data in January, we also released five-year percent change indicators, so you could compare to the 2006-2010 data. Now, you can look at those percent changes, and see the data for the appropriate base year. (Keep in mind, not all indicators were available in 2006-2010, so not all will have this historical data or the percent changes.)
It’s a little change, but we hope it helps you better understand the data you’re using.