
ACS for 2010-2014 Is Up! Lots of Goodies!
 After months of preparation and round-the-clock processing, the 2010-2014 American Community Survey is up on PolicyMap. ACS data from the Census Bureau has many of the most-used indicators on PolicyMap. There’s a ton of new stuff in this update, so let’s get right to it:
Latest Data
This data is a year more current, ensuring that it’s closest to representing the current state of your community.
Zip Code Tabulation Areas
This year, instead of doing internal calculations to produce Zip Code data, we’re using more accurate Zip Code Tabulation Area data straight from the ACS. This means the boundaries might be a little different than they were before, but the data within those boundaries will be more accurate. This affects a lot of areas of PolicyMap, so read more here.
New Indicators
We’ve added 93 new indicators this year. Highlights include:
- People who were born in and born outside their current state of residence
- People who are hearing or visually disabled
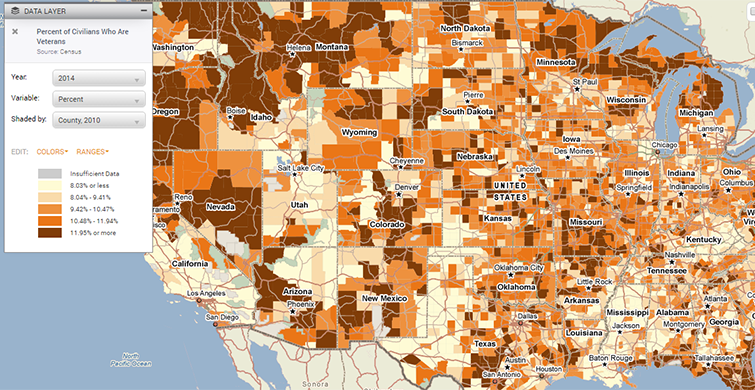
- Veterans
- Household income and household size by housing tenure (owner vs. renter)
- Children under age five in poverty
- Median real estate tax
Click here to interact with map.
Comparisons to 2005-2009

The Census Bureau says that five-year ACS estimates shouldn’t be compared with other five-year ranges that overlap. Since the first five-year ACS data was 2005-2009, this is the first year we can make those comparisons. So in addition to the new 2010-2014 data, you can also change the time frame to 2005-2009.
Over the next few weeks, we’ll have posts expanding on each of these updates, so stay tuned. And once again, we highly recommend that you read about the new ZCTA data, since it’s likely to affect the way you use PolicyMap.