
America’s Infrastructure Crisis: Visualizing the Local Impacts
Data
Deficient Bridges
Source
Find on PolicyMap
- Economy
- Infrastructure
- Deficient Bridges
- Structurally Deficient Bridges
- Functionally Obsolete Bridges
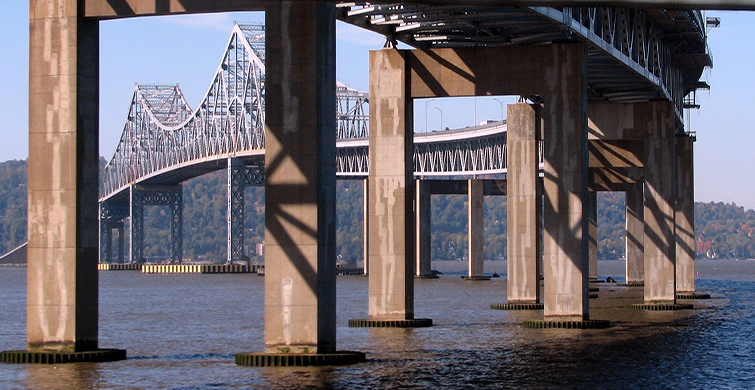
It’s no secret that America is in the trenches of an infrastructure crisis. Roads, bridges, railroads, ports, electrical grids, water and wastewater systems across the country have been neglected for years and are in dire need of repairs.
The latest infrastructure report card from the American Society of Civil Engineers (ASCE) gave the country an overall grade of D+. Now, with deficient bridges data recently added to PolicyMap, you can conduct a deeper investigation into the local impacts of the infrastructure crisis by examining a key piece of infrastructure that touches most Americans on a daily basis. Deficient bridges include two point datasets in PolicyMap – structurally deficient bridges and functionally obsolete bridges. Both datasets can be found in the Economy menu (Economy > Infrastructure > Deficient Bridges).
Structurally deficient bridges are characterized by some kind of deteriorating structural conditions and reduced load carrying capacity; they typically require significant repairs or complete replacement. Functionally obsolete bridges, on the other hand, are structures that fail to meet current design standards either because of revised engineering standards or increased traffic volumes on the facility.
The source of the data in PolicyMap is the National Bridge Inventory (NBI), which the Federal Highway Administration (FHWA) compiled from state departments of transportation in 2014. While recently implemented improvements to structures will not be reflected in the data, keep in mind that major structural work typically takes multiple years to progress through all of the design, utility clearance, right-of-way acquisition and construction phases.
Navigating Local Impacts of the Infrastructure Crisis in PolicyMap
One of the most intriguing aspects of the NBI data is the wealth of information provided for each structure. We sought to include some of the most interesting fields from the NBI, such as maintenance responsibility; average daily traffic; historical significance; structure type and material; and bridge condition ratings for the bridge deck, superstructure, and substructure. We think that all of these details will really excite the bridge fanatics out there! After clicking on a point, you can scroll through the different tabs in the info bubble to see the detailed data for each structure.
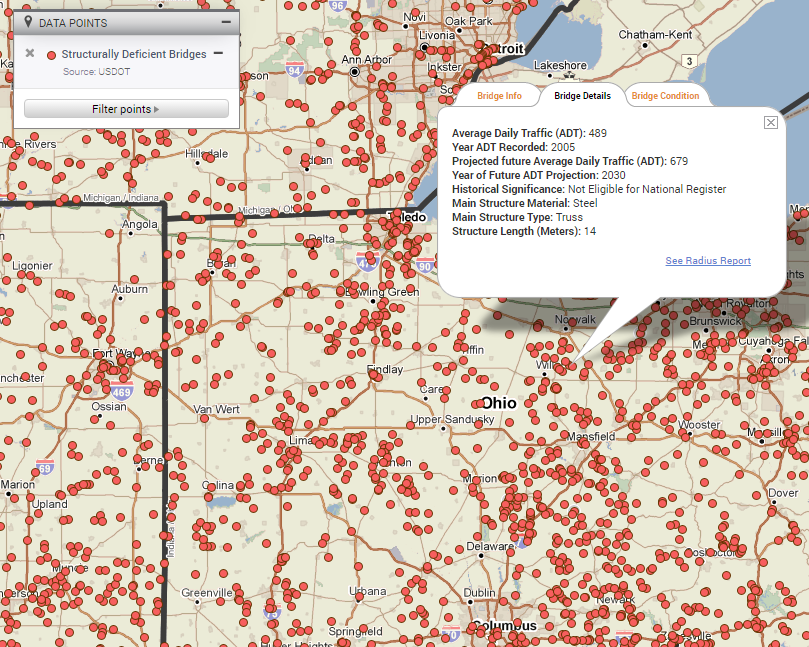
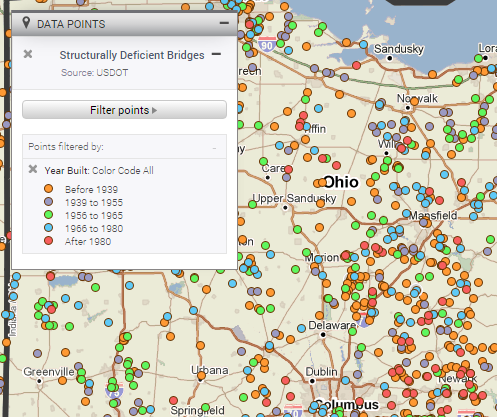
What if you just want to see bridges that are closed to traffic or have posted capacity restrictions? You can filters these out through the legend. The map below shows structurally deficient bridges color coded by the year in which the structure was built.
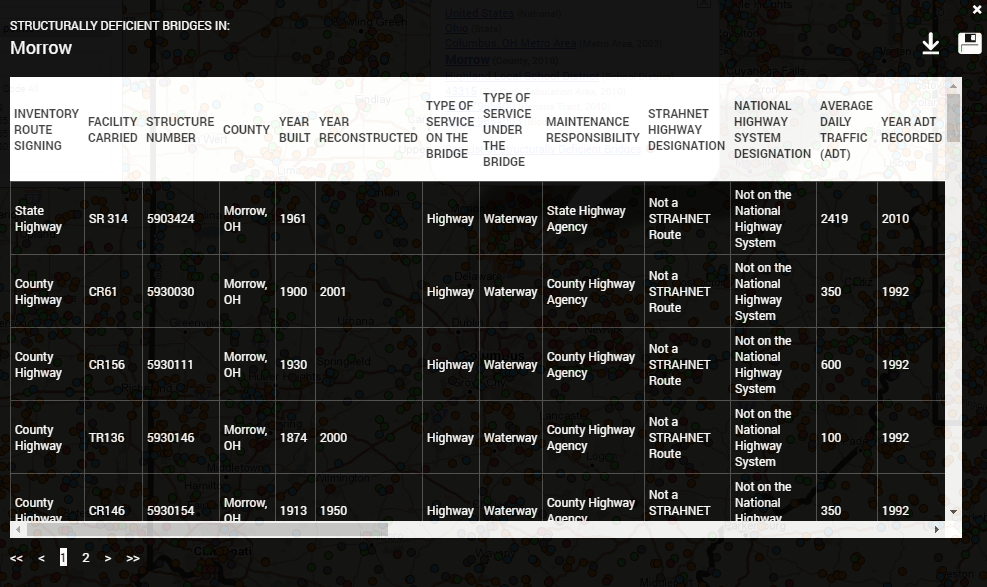
You can also use this data to generate a downloadable list of deficient bridges within a particular geographic boundary. Let’s say I wanted to see a list of deficient bridges in the county where I live (I’ll use Morrow County in central Ohio as an example). I can click on Morrow County on the map and select to see a list of structurally deficient bridges. From there, I can view or save the table of all deficient bridges in Morrow County or download that list to a csv.
I can also generate counts of deficient bridges and compare across multiple geographies using PolicyMap Tables. For instance, let’s compare the number of structurally deficient bridges in the counties that make up the Mid-Ohio Regional Planning Commission (MORPC) – the designated metropolitan planning organization for central Ohio around the state capital of Columbus. MORPC includes 15 counties in total.
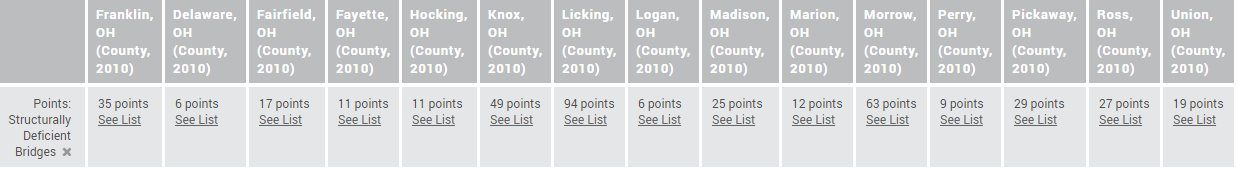
These figures show that Licking County is experiencing the greatest impact from the current infrastructure crisis (at least as it pertains to bridges) and is the highest-need county in the region. This type of information can help to facilitate and inform conversations about how to allocate limited funding in the region to address deteriorating infrastructure.
From this table, you can select the link under the count of bridges for each county to see the specific list of structurally deficient bridges and detailed attributes for each structure.
The declining state of America’s infrastructure is a highly visible issue affecting all communities, large and small. Hopefully, the new deficient bridge data available in PolicyMap will help you better visualize the local impacts in your own neighborhoods and communities.