Announcing the Winners of the Place Database Contest

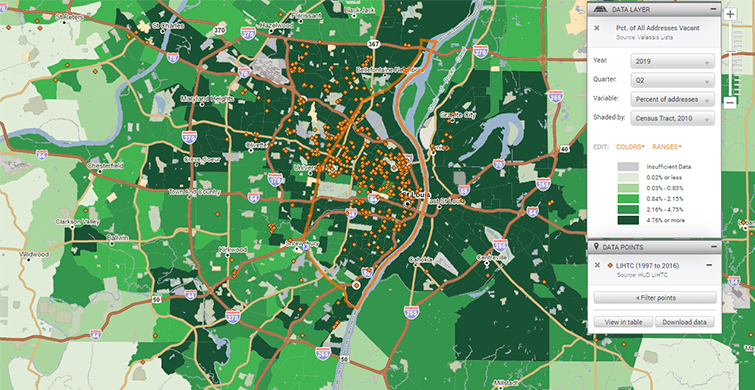
What can data on a map tell us about land policy? It can show how some zoning regulations perpetuate racial inequality. It can show how city parks can mitigate flood risk in low-lying areas. It can show how an urban growth boundary might prevent suburban sprawl.
These are some of the winning submissions in The Place Database Contest from the Lincoln Institute of Land Policy. The Lincoln Institute of Land Policy teamed up with PolicyMap to create The Place Database, to make important data about our communities, cities, and states more accessible, easier to use, and visually compelling. The contest invited people to use The Place Database to show how data and maps can tell a story and help solve a problem.
Here are the winners, with links to their winning submissions:
“The Role of Zoning Regulations in the Perpetuation of Racial Inequality and Poverty: A Case Study of Oakland, California”
Amy DeNinno
Mills College, Oakland, California
“The Challenge of Affordability Within the Dallas-Fort Worth (DFW) Metro Area”
Reza Sardari, PhD, GISP
Urban Planning & Public Policy
UT Arlington, Texas; Analyst at Cintra
Raha Pouladi, GISP, PhD Candidate
Urban Planning & Public Policy
UT Arlington, Texas; Planner at City of Celina
“How Can Cities Unleash the Flood Mitigation Potentials of Urban Parks? The Example of Houston, Texas”
Trang Le
Texas Department of Recreation, Park and Tourism Sciences
Texas A&M University, College Station, Texas
“How an Urban Growth Boundary Could Save Buffalo-Niagara”
Matt Bowling, AICP
These submissions do a wonderful job of showing how data and mapping can address current issues like housing affordability and climate change. They’re worth reading, because the ideas they offer can be applied to any other city in the country.
Congratulations to the winners! And even though the contest is over, please let us know how you’re using data and mapping to solve current issues!