
Breaking Down Barriers to Healthy Living

Data
Medical Spending Data
Source
PolicyMap & Quantitative Innovations
Find on PolicyMap
- Incomes & Spending
- Spending and Affordability
- Medical Spending Estimates
- All Medical Care
- Prescription Medications
- Office Visits
- Dental Care
- Eyeglasses and Contact Lenses
- Medical Spending Estimates
- Spending and Affordability
One of the major obstacles for people with chronic health conditions to leading longer, healthier lives is the rising expense of prescription medications. Often, people must make tough choices between paying their rent on time, buying healthy foods, and purchasing their medications. Even for those with insurance coverage, out of pocket prescription costs can be prohibitively high.
Data on these costs can help public health officials, planners, providers, and advocates craft programs to help residents obtain the medicine they need through two main avenues—helping people meet their out-of-pocket costs and curbing rising prices.
New Medical Spending estimates, developed by PolicyMap, allow data users to see which neighborhoods are likely burdened the most by medical expenses. The data also provides estimates of total volume of out-of-pocket spending for all residents, as well as the total volume of spending on medical care, including payments by insurance companies, which can contribute to market analyses.
A pastiche of programs can provide direct financial assistance to people purchasing expensive medications. Patient Assistance Programs (PAPs), for example, typically provide direct assistance from the pharmaceutical companies that develop and sell expensive brand name medications. Patients can apply to these companies directly for assistance or can apply through websites that serve as one-stop-shops for PAPs.
However, people with language barriers or limited computer or internet access may not know about these programs or may have difficulty applying. Therefore, these people, or those in similar situations, could benefit from pharmacy- or health center-based programs that help them apply for this kind of direct assistance.
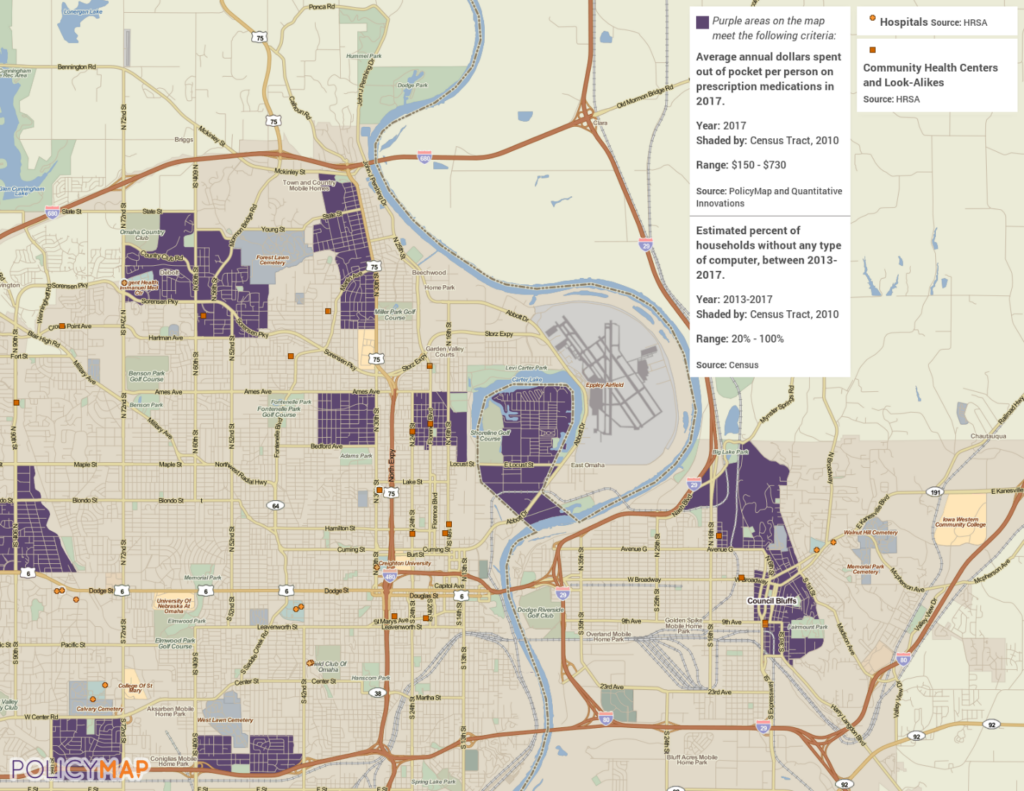
For an example of how this might be useful, the map below shows areas in Omaha where residents likely face high spending on prescription medications and where higher proportions of the population have limited access to computers.
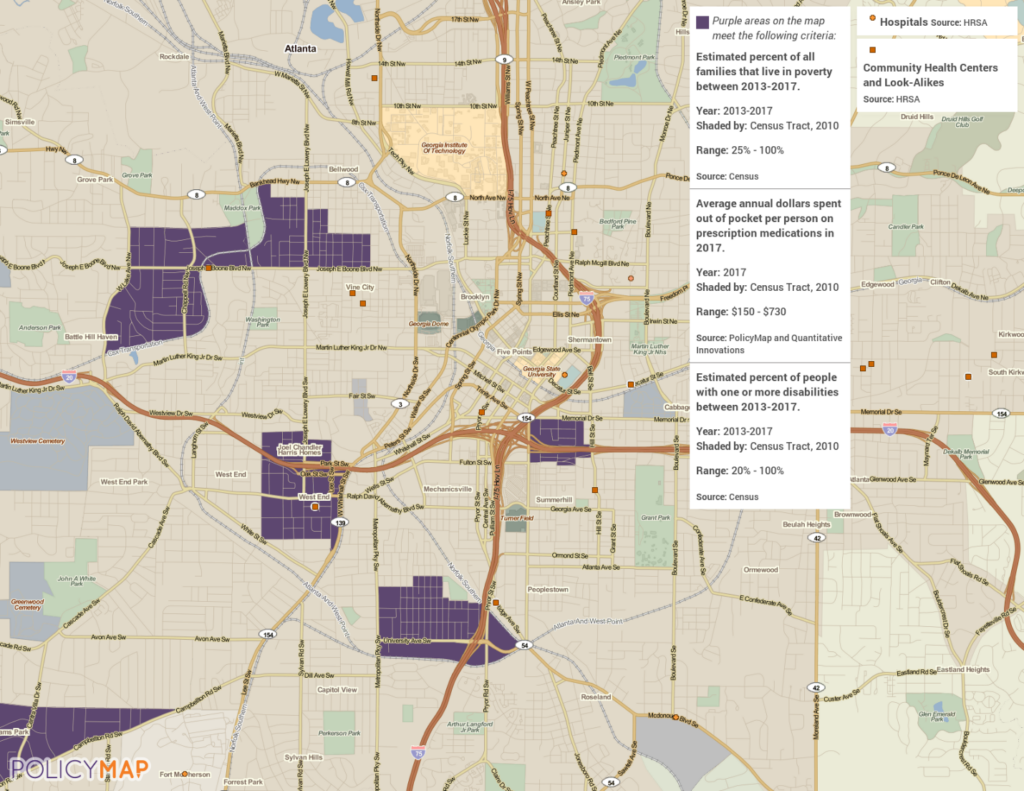
In some places, hospitals have developed programs that provide free or reduced-cost medications to their patients, helping to decrease reliance on more expensive emergency department care. In some cases, this can mean developing a service that connects patients with existing PAPs. In others, hospitals have directly covered the cost of medications for their patients who are uninsured or underinsured. The map below, for example, shows areas in Atlanta that might benefit from these kinds of programs. It shows areas of poverty where more than 20% of the population has a disability, and where average prescription costs are likely to be high. Points showing hospitals and community health centers show institutions that might help with these programs.
These estimates are based on information on medical spending collected in a national survey called the Medical Expenditure Panel Survey. The survey is conducted by the Agency for Healthcare Research and Quality combined with demographic and healthcare data published by the Census Bureau from the American Community Survey. It’s meant to be used to predict areas with high medical spending. It should not be used to measure outcomes of existing programs.
This data is available to premium subscribers, and is accessible in both the “Incomes & Spending” and “Health” menus.