
Access Local Health Data with CDC PLACES

Analyze population-level health conditions and risk factors and estimate community health measures
Data
CDC PLACES
Source
Centers for Disease Control and Prevention (CDC)
Find on PolicyMap
- Health
- Risk Factors
Now available on PolicyMap to our premium subscribers, the CDC’s newest dataset ‘Population Level Analysis and Community Estimates’ (PLACES) allows users to understand the distribution and frequency of 30+ chronic conditions, risk behaviors, health statuses, and prevention methods in 2019. Several examples of indicators include heart disease, cancer, diabetes, depression, binge drinking, smoking, health insurance enrollment, and frequency of medical checkups. Every CDC PLACES indicator is available at the City, County, Zip Code Tabulation Area (ZCTA) and Census Tract level.
What is CDC PLACES?
The CDC PLACES dataset replaces, updates, and improves upon two of PolicyMap’s previous datasets: our custom Small Area Health Data dataset, and the CDC’s 500 Cities dataset. Previously, we developed our own in-house community health estimates based on CDC data, but now, this crucial health data is available directly from the source. The CDC’s PLACES program is also an expansion of the CDC’s own small area health estimates that they created for their 500 Cities program starting in 2015.
The 500 Cities program used statistical techniques to produce estimates for various health outcomes or risk factors at small areas for the largest 500 Cities in the United States. The PLACES program expands these estimates across the country, and makes the data available for Census tracts, ZCTAs, Census places (which we call Cities on PolicyMap), and Counties. These estimates were created using the CDC’s Behavioral Risk Factor Surveillance System (BRFSS), the 2010 Decennial Census, and estimates from the American Community Survey.
How are the CDC PLACES indicators measured?
The CDC publishes both crude and age-adjusted estimates. Many of the chronic health conditions and risk factors estimated in this dataset have a strong correlation with age. This means that areas with much older populations may have deceptively high crude rates of illness. Age-adjusted estimates correct for the different age profiles of different geographies, which makes it easier to understand whether certain health conditions are truly worse in certain areas. Crude rates are available at the Census tract, ZCTA, City, and County levels, and Age-adjusted rates are available at the City and County levels.
What health conditions and risk factors does CDC PLACES include?
PLACES variables include the following chronic conditions: arthritis, asthma, heart disease, high blood pressure, cancer, high cholesterol, kidney disease, COPD (lung disease), depression, diabetes, obesity, all teeth lost, and stroke. Prevention: lack of health insurance, routine medical checkups, dental visits, high blood pressure medication, cholesterol screening, mammography, cervical cancer screening, colonoscopy, core clinical preventive services for male and female older adults. Risk behaviors: binge drinking, smoking, no physical activity, limited sleep. Health status: poor mental health, poor physical health, poor self-rated health.
What are some uses for CDC PLACES?
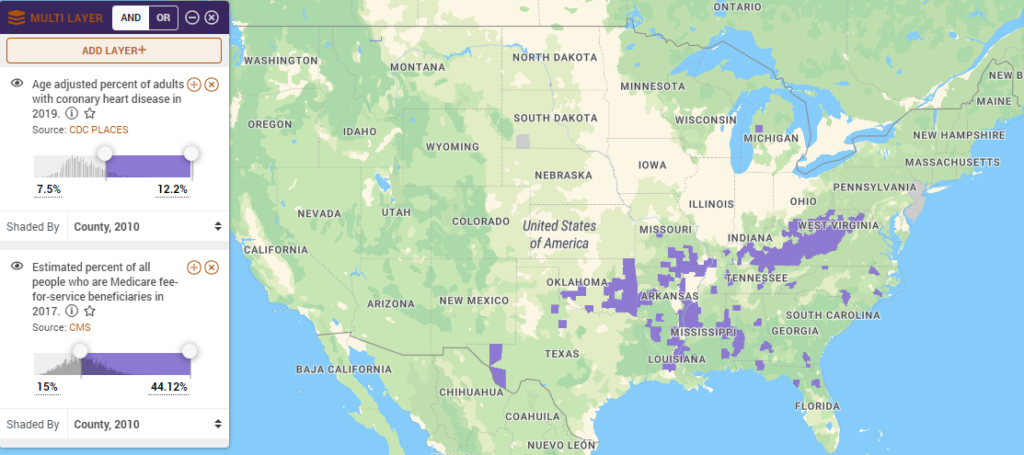
Using CDC PLACES data and a Medicaid dataset from Centers for Medicare & Medicaid Services (CMS), this map examines US Counties where 7.5% or more adults have coronary heart disease, and 15% or more adults are beneficiaries of Medicare. The map shows that Medicare beneficiaries and heart disease cases are significantly clustered in the American South, including states such as Kentucky, Tennessee, Missouri, Oklahoma, Arkansas, Mississippi, and Louisiana.
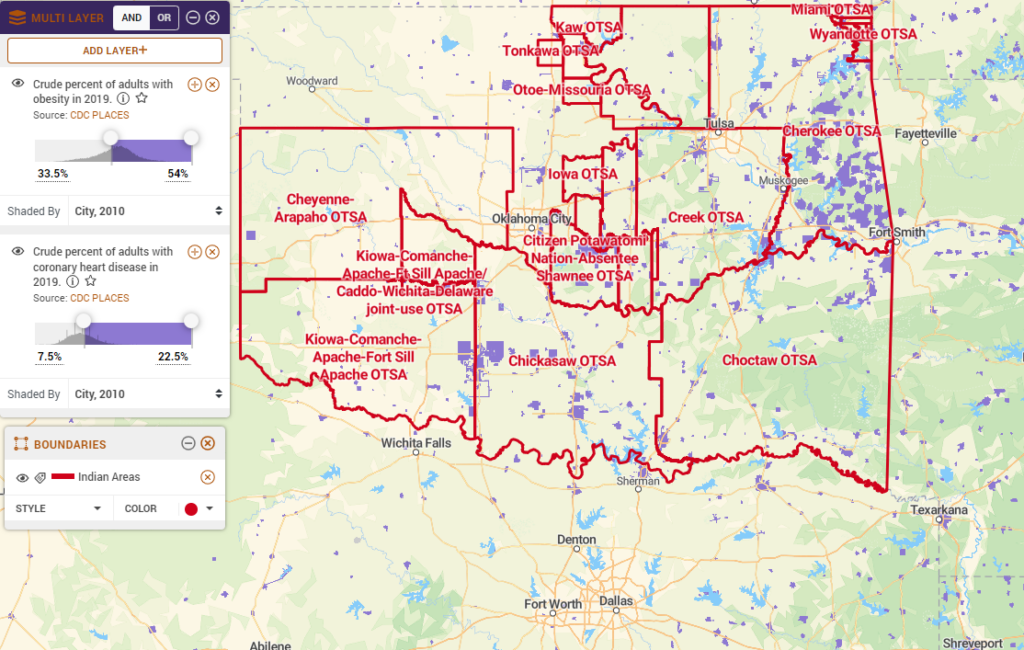
This map shows all Cities (also known as Census places) in Oklahoma where 33.5% or more adults are obese, and 7.5% or more adults have heart disease, in comparison to federally recognized Indian Areas. The frequency of obesity and heart disease is far higher in many of these Native American territories than the surrounding areas, which show the endemic health concerns faced by many Native American communities.
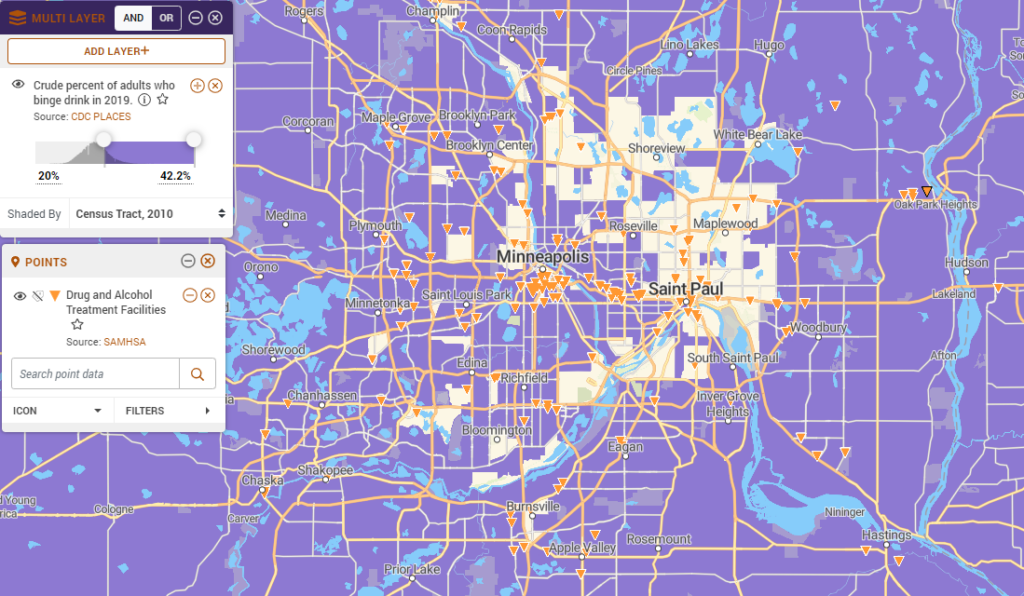
This map shows all census tracts in Minneapolis and Saint Paul, Minnesota where 20% or more adults are self-reported as binge drinkers, compared to the placement of alcoholism rehabilitation facilities. Using CDC PLACES data at the census tract level, is is clear that alcoholism is more common in the suburban and rural communities surrounding the Twin Cities, but less common the the urban core. Despite the lower rate of binge drinking, the majority of drug and alcohol treatment facilities are located within the Twin Cities, with far fewer facilities in the surrounding rural communities, where binge drinking is far greater of a community health concern.
To learn more about CDC PLACES data, contact us.