
Changes to BLS’s Local Area Unemployment Statistics
One of our more popular datasets, the Bureau of Labor Statistics’ (BLS) Local Area Unemployment Statistics (LAUS), has undergone some methodological modifications that could affect how you use it. For those of you not interested in hearing the gritty details, the data is now “more gooder”, but newer data is not comparable to data from before January 2010. Also, the metro area data now shows at the new 2013 boundaries.
Roughly every ten years, the LAUS program at the BLS reviews their methodology for calculating unemployment (as well as employment and labor force). This way, the data isn’t locked into a process created decades ago, but evolves with new understanding and available data.
For the specific changes to the methodology, you should check out the BLS’s pages of description, but here’s their summary:
The 2015 LAUS Redesign includes improved time-series models for the census divisions, states, select substate areas, and the balances of those states; an improved real-time benchmarking procedure to the national Current Population Survey (CPS) estimates; an improved smoothed seasonal adjustment procedure; and improved treatment of outliers.
Non-modeled area estimation improvements include: updated Dynamic Residency Ratios (DRR); more accurate estimates for all-other employment; more accurate estimation of agricultural employment; and improved estimation of non-covered agricultural unemployment. Handbook estimation is now done at the county level instead of at the Labor Market Area (LMA) level, which better reflects local conditions. The Redesign also introduces estimation inputs from the American Community Survey (ACS) to replace inputs that were previously obtained from the decennial census long-form survey.
In addition, 2010 Office of Management and Budget (OMB) delineations for metropolitan areas, metropolitan divisions, and micropolitan areas and new LAUS small labor market areas will be implemented with the 2015 LAUS Redesign.
The new statistical model was used to recalculate state-level data, going back to 1976 (PolicyMap shows data going back to 2000). However, for other geographies (counties, metro areas, cities, and metropolitan divisions), the data is only recalculated back to 2010.
That’s important: Substate data from 2000 to 2009 uses a different methodology than data from 2010 to the present. This means, if you’re comparing data from before 2010 to data since, you should be aware you might be comparing apples to oranges, or at least a different kind of apple.
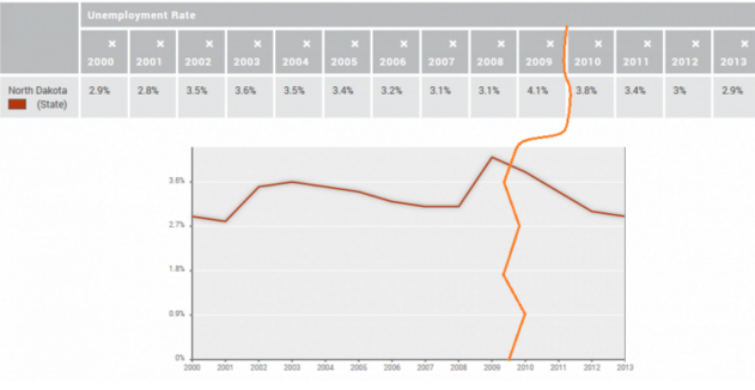
PolicyMap lets you create time-series charts of data on the Tables page. You can continue to make these charts, but you have to imagine a line separating the pre-2010 data from the more recent data:

And there’s one more change we mentioned earlier: The metro area (or CBSA) and metropolitan division (MD) data are being mapped to the new 2013 Census CBSA and MD boundaries, going back to the beginning of the dataset. Some big CBSA’s, like New York’s and Los Angeles’s have undergone big changes, and now encompass larger areas. We’ll have more about these new CBSAs in a future blog post, because there’s a lot to say about them.
Unemployment (and employment) data is available to all users, in the Economy data menu.