
Childcare Costs Take a Growing Share of Family Income

In counties across the United States, childcare costs can become incredibly burdensome. Full-day infant care can cost a typical family anywhere from around 5% to 30% of the median family income. Even for older school-age children, part-day care (e.g., before and after school care) costs up to 23% of the median family income, according to 2022 data. Recent data from the National Database of Childcare Prices (NDCP), now available on PolicyMap, demonstrate the steep and often strenuous childcare prices parents face, underscoring the already-tangible financial burden that such families experience.
National Database of Childcare Prices (NDCP) from the Department of Labor
The National Database of Childcare Prices (NDCP) from the U.S. Department of Labor includes the cost of childcare and the cost of childcare as a percent of median family income at the county-level by care-type (center or home-based) and age (infant, toddler, preschool, or school-age) for 2018 and 2022. Childcare affordability data is also available at the state level from 2008 to 2022.
Childcare Prices by County, Age, and Care Type
Childcare is widely known to be expensive, and the latest data helps illustrate just how high the costs can be. In 2022, center-based infant care ranged from about $3,924 (roughly $4,352 in 2024 dollars) to more than $31,544 (about $34,982 in 2024 dollars). In many places, these annual costs rival, or even exceed, what families pay in rent.
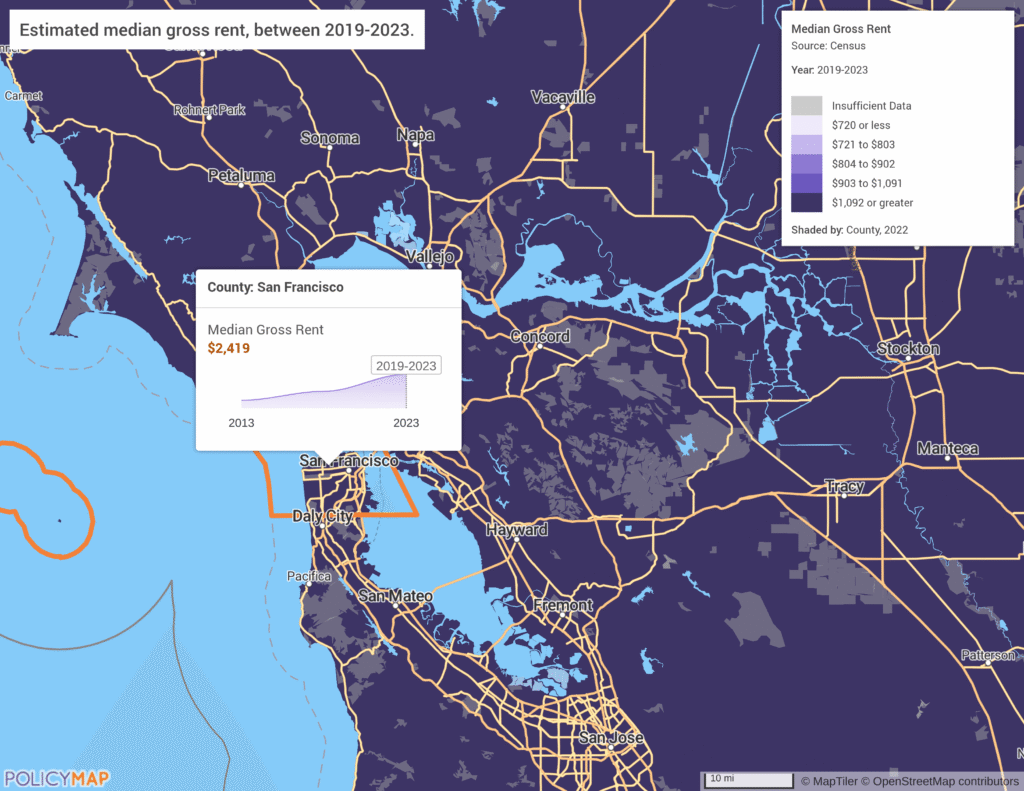
San Francisco County, for example, has one of the highest median prices for center-based infant care at $31,544 per year.
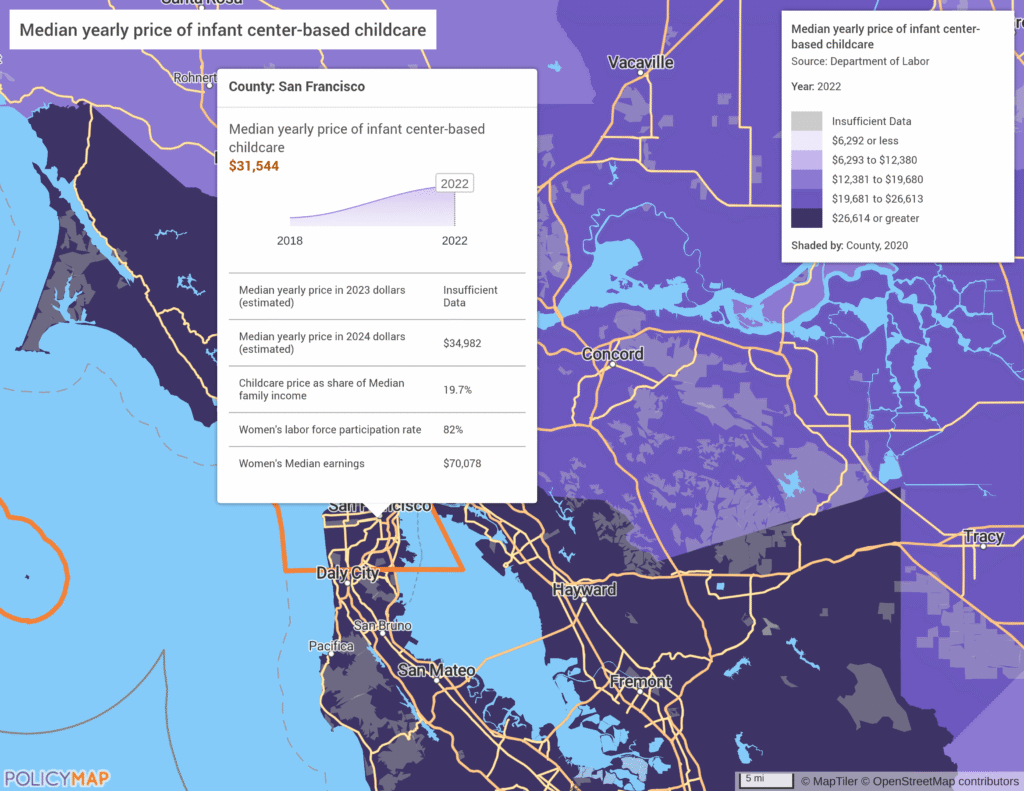
Compared to the annual median gross rent, which costs roughly $29,028, based on the monthly prices shown below. It is deeply concerning to see the cost of childcare rising faster than basic living expenses.
Childcare prices as a share of median family income
Childcare costs are high across the country, but the share of income families devote to care varies widely. In some places, childcare accounts for a much larger portion of what families earn. In Suffolk County, MA, for example, infant center-based care accounted for about 29% of the median family income in 2022—the highest share reported.
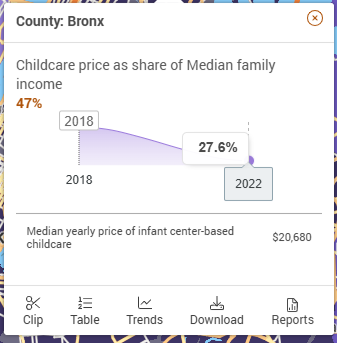
Although childcare remains untenable for many, “prices in 2022 made up a smaller share of median family income than in 2018 (16.0% and 19.3%, respectively)…Experts estimate that prices would have been even higher were it not for the American Rescue Plan [in 2021].” The decrease is especially pronounced in Bronx County, NY, where families spent an average of 47% of median income on care for one child in 2018 versus 28% in 2022.
State-level data: Childcare affordability quintiles and the affordability gap
In addition to childcare prices and childcare prices as a percent of median family income, the NDCP provides a breakdown across affordability quintiles. A quintile means one of five equal-sized groups that range from the lowest values to the highest values. “This metric estimates the percentage of the child population within each state living in areas at different childcare affordability quintiles.”
These indicators are available in the multi-indicator bubble on the Affordability Gap layer. Looking at these values, we can see which state has the highest percentage of children living in countries where families spend the highest percentage of income on childcare (quintile 5), which state has the highest percentage of children living in counties where families spend the lowest percentage of income on childcare (quintile 1), and see the distribution across each quintile.
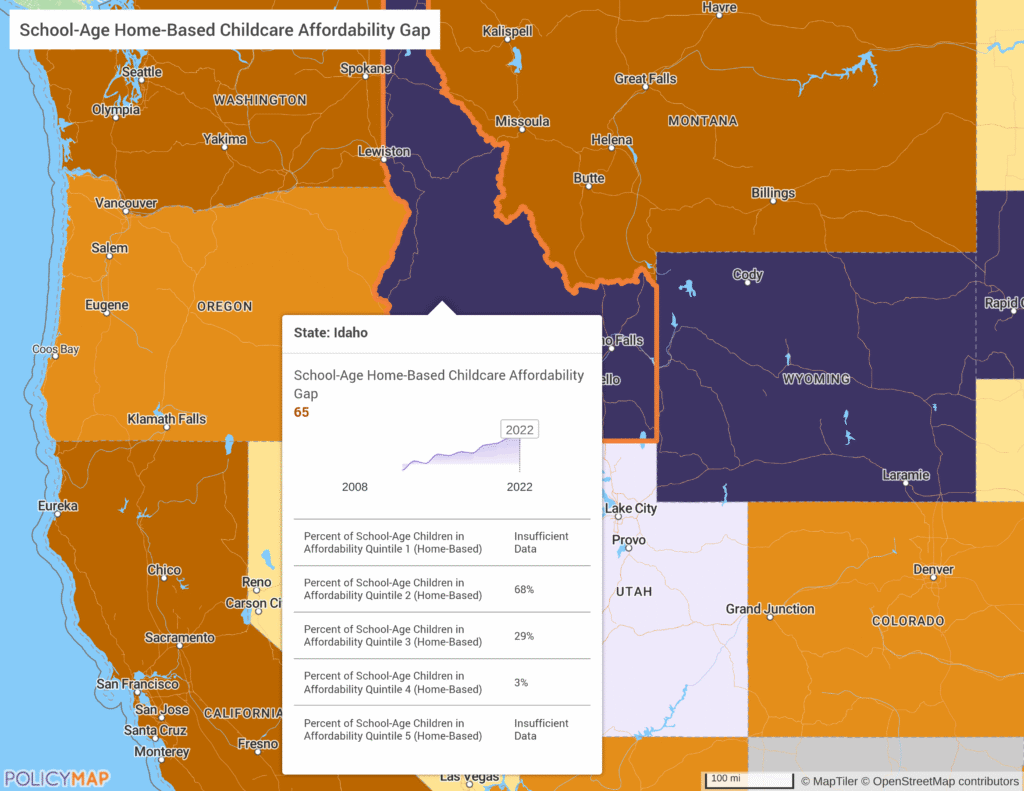
The Affordability Gap was calculated to allow users to compare the lower and upper ends of affordability within the same state (i.e., comparing the quintiles on the same map). In technical terms, it’s subtracting the upper quintiles from the lower quintile. In practical terms, it helps answer the question “What level of childcare burden are most children facing?” Values range from -100 to +100, where values closer to +100 indicate that most children in the state experience more affordable childcare, and values closer to -100 indicate that most children in the state experience less affordable childcare.
For example, if a state has an affordability gap of -86, it means that a large share of children in that state are in the least affordable quintiles, so childcare tends to cost a larger percentage of their median family income.
Research from the Department of Labor has shown that reducing childcare providers’ prices is not a feasible solution. Childcare is not only a very labor-intensive service, but also, when most provider costs are allocated to staff, it leaves thin operating margins for providers. And proper child-to-staff ratios are also essential in ensuring children’s safety and development. “The current funding system, therefore, is reliant primarily on overburdened families and underpaid childcare workers, contributing to substantial turnover and lack of adequate childcare supply.” The American Rescue Plan provided temporary relief, yet additional federal investments are needed to alleviate the burden of childcare and improve access for all families.
Request More Information
Looking to explore childcare affordability in your community? Dive into the full NDCP dataset on PolicyMap to compare costs, identify disparities, and uncover trends. Reach out to our sales team using the form below if you’d like to learn more about applying these insights to your work.