
Color Me Curious: Why PolicyMap Maps are Purple
Data visualization is a powerful tool—colors can provide very meaningful context, but they can just as easily make for a very misleading representation of your information. There are a few things to think about when choosing colors to symbolize your data, namely, color properties, connotations, and relationships to other objects or features on the ground.

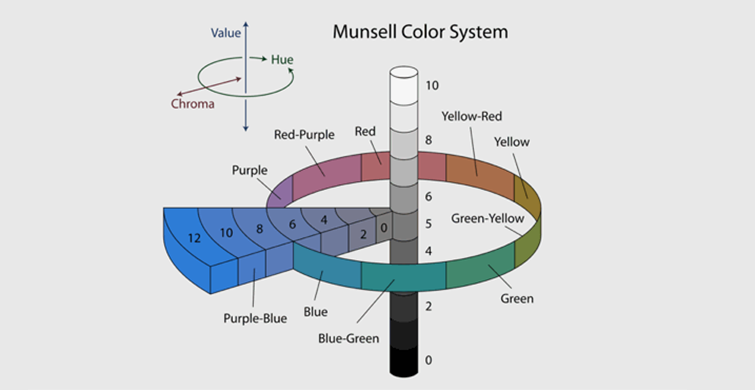
The technical portion of color choice deals with how colors are interpreted by the human eye, and how they look on our computer screens. Colors have three distinct properties: hue (the name of the color), value (lightness or darkness), and saturation (brightness or dullness). Because colors have these intrinsic qualities, we are able to use variations on these properties to give meaning to our data. This means that rather than using a spectral (rainbow) color scheme to represent information, we can provide color gradients to allow people to see gradual changes. Rainbow colors are not necessarily bad when used for categorical data, such as types of program eligibility, but seem nonsensical when used to represent continuous data (i.e. temperature, or crime rates).
Some colors are more difficult to see and distinguish than others (yellow, for example), while other colors might seem to make a statement about your data (red, for instance, may imply something bad). It is also important to remain aware of relationships with other map features, which is why displaying data as blue or green (colors typically used for bodies of water or parks) could make it more difficult for someone to differentiate between said features.
At PolicyMap, we use purple as the default setting for our maps. This isn’t due to branding, or to our love for singer-songwriter Prince, rather, we use purple because it is an attractive and non-deceptive way to represent a broad range of datasets. We can also use supplementary colors to strengthen our visualizations; here at PolicyMap we often use the color orange to display negative values.
Use the map below to take a look at how we represent population change in purple and orange. In this case, the saturation of each color reflects the estimated percent rise or decline of population.
There are myriad ways to display information on a map, and we hope that this brief introduction to color and visualizations has provided some helpful pointers to help you choose how best to represent your own data! For a more complete discussion, check out our Mapchat: The Art of Making Maps.