
County Business Patterns: Bigger and More Complicated
We’ve updated our County Business Patterns data from the Census to include 2011 data. County Business Patterns has information about the number of employees who work in different industry sectors. Its name is misleading, because the data goes down to the county and zip code level.
With this update, we’ve made some interesting changes that give you access to more complete data throughout the country.
When you load the data (which is in the “Jobs & Economy” tab, in the “Jobs & Wages” section), you’ll see there are four toggles, and two of them say “Est”:

The # and % toggles show data at the state, metro, and county level. They show actual numbers of employees, as provided by the Census. However, to ensure privacy, they suppress data from any area where there are so few establishments that you can identify the number of employees working for a specific company. So if a town’s economy was dominated by one big factory, with few other employers, that area’s data would be excluded.
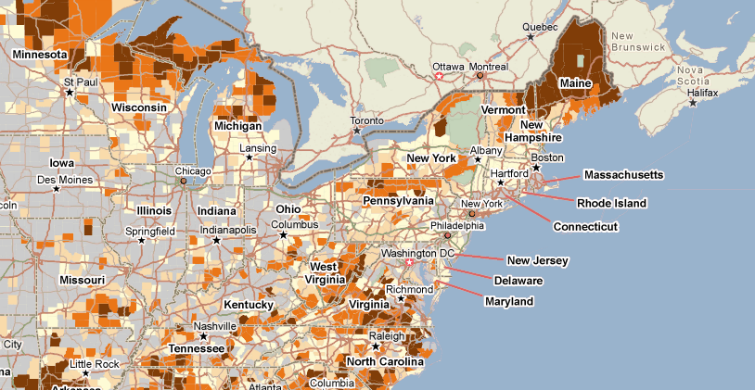
It sometimes results in a sparse map, with “Insufficient Data” showing up in areas where a substantial number of people work. Here’s a map of lumberjacks in New England (technically the “forestry and logging” industry); note the large swaths of gray:
To solve this issue, we have the “Est” indicators. The “Est” indicators are estimates, calculated using the number of establishments in an area by size. For instance, a given county might have 3 establishments with 1-4 employees, and 2 with 5-9. We’d calculate that 3 establishments have an average of 2.5 employees (3*2.5=7.5) and 2 have an average of 7.5 (2*7.5=15), therefore, that area would have about 23 employees. It’s inexact, but there are no suppressions, so the map is much better populated:
Note how in the first map, Vermont’s Northern Kingdom and Maine’s Mid-Coast look like they have no forestry and logging activity, while the second map show that in fact, it’s a busy business there. You don’t get the exact number, but you know it’s a big industry.
One other crucial benefit of the estimated values is that they can be viewed at the zip code level (as well as county and metro area), so you can see how many employees are working in different areas of a county.
County Business Patterns data is available to all PolicyMap users.