
Custom Region – The Geography Rule
Welcome to our series on helpful tips for PolicyMap. With over 15,000 indicators of data and many features, we hope our series can help users better utilize PolicyMap. For a complete training, please join a free online session here: Click Here
Did you know the custom region feature for subscribers gives users the ability to draw right on top of the map to create their own target areas. Once a custom region is drawn, users can then open a custom region in the Tables feature to see aggregated counts or list of geographies that make up the custom region; or open in Reports to get aggregated numbers.
A custom region can contain any geography and cross multiple geographic boundaries and boundary types; we decided to create a blog series and review some of the unique rules for custom regions to make sense of how data is aggregated and how custom regions display data.
 The Geography Steps – The geography used to aggregate data for a custom region is determined by the size of the custom region, which in turn determines the zoom level the custom region displays at. When you open a custom region, the location of the zoom bar will determine what geography by default will be used to aggregate data. This is also called the default zoom level.
The Zoom Bar on the left shows the numerical scale used for identifying the current zoom level on the map. The zoom level of zero (0) at the bottom is the farthest zoomed out (usually displaying the US and data by states) and 15 at the top is the closest zoomed in (this will show street level and data at blockgroups). 2 is the default zoom level when you first open PolicyMap.
GeoSteps is a term on PolicyMap used to determine what geography data can be downloaded at using See Values or what default geography is used for aggregation in Reports. The chart below shows the GeoSteps used for 2000/2010 Census and American Community Survey data. Between zoom levels 12-15 (the top most zoom levels of the Zoom Bar), blockgroups will be used to aggregate data as a default. After the zoom level of 12, census tracts would be the default geography, then counties will be the default at level 8, and finally state level data after zoom level 5.
- 12: Block Group
- 08: Census Tract, Block Group
- 05: County, Census Tract, Block Group
- 00: State, County, Census Tract, Block Group
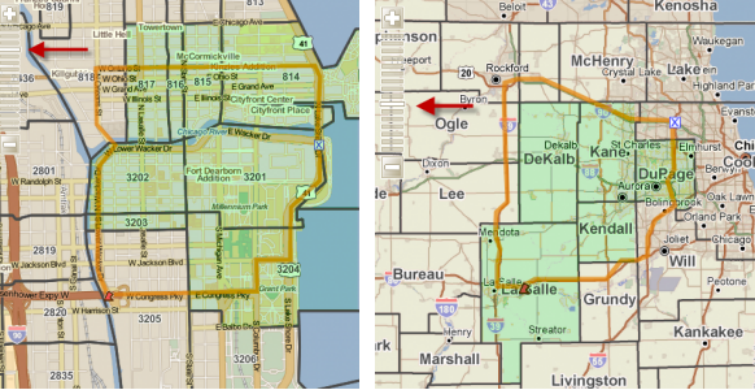
In the example on the left, the custom region’s default zoom level is at 12 which would mean that the green highlighted census tracts will be used as the default geographies when aggregating data in reports or shown in Tables.


The example on the right, the custom region is much larger in geographic size encompassing many counties near Chicago, IL so the default zoom level when loading the custom region is 6. This means that counties will be the default geography used to aggregate data and the green highlighted counties will be used for aggregation in reports and tables.
A couple of the reasons for the GeoSteps:
- To make PolicyMap fast and responsive to users, we needed to scale the amount of resources used when aggregating data so the GeoStep allowed the program to select larger geographies that covered more area to aggregate by. (For example, it is faster to aggregate data for the 67 counties of Pennsylvania than the 10,387 blockgroups)
- Another reason was to help users make sense the geographies that make up a location. (For example, it is easier understand a list of data for the 50 states that make up the US, than a list of the +200,000 blockgroups in the US)
On the latter point, keep an eye out for our upcoming releases as we plan to give users the ability to choose the geography used to aggregate reports and eventually choose to the geography to download in the Tables feature also.
In our final Custom Region blog entry, we will talk about the unique rules accompanying the ability to assemble custom regions.
To read a full guide on all features on PolicyMap, please look at our Primer available here. If you wanted to know more about a feature or topic, send your request to info@policymap.com subject “Tutorial Topics”.