
A Pathway to Rapidly Cutting COVID-19 Deaths through a Risk-based Vaccination Strategy

Data
COVID-19 Excess Mortality Risk Index
Source
Find on PolicyMap
- Health
- COVID-19
- High Risk Populations
Note: this blog is co-authored by Eliza Wallace, PhD, Data Development Lead at PolicyMap and Nilanjan Chatterjee, PhD, Bloomberg Distinguished Professor at Johns Hopkins University
Promising results from initial phases of COVID-19 vaccine trials have prompted discussions among public health organizations such as the CDC and the WHO on how to distribute a newly released vaccine. When the first vaccine becomes available, supplies will be limited, and difficult choices will have to be made as to who will be vaccinated first. One possible criterion for this decision includes occupation—first vaccinating those in the health care profession who must stay healthy to treat the virus in others. But consensus is forming that those at highest risk of dying from the virus should also be prioritized for vaccination. New data released from researchers at the Johns Hopkins Bloomberg School of Public Health, in partnership with PolicyMap, identifies those populations at highest risk of death due to COVID-19. This week, we’re making the results of the study actionable with two new tools—the COVID-19 Mortality Risk Calculator, and COVID-19 Risk Maps.
The COVID-19 Mortality Risk Calculator
As data on the demographics and clinical characteristics of those who were experiencing the worst COVID-19 symptoms became available, several factors emerged as clear contributors to COVID-19 mortality, including age, sex, race, socioeconomic conditions, and underlying health conditions. Translating this information into estimates of an individual’s level of risk, taking into account both these predisposing factors and community level dynamics, however, has been challenging. The novel web-based risk calculator allows users to input information on their risk factors to obtain estimates of mortality risk from COVID-19. Users are returned both a “relative-risk” in reference to the average risk in the US, and an “absolute risk,” which incorporates state-level information on pandemic dynamics from an underlying forecasting model. Learn your own risk level with the COVID-19 Mortality Risk Calculator.
The COVID-19 Risk Maps
The researchers then applied the risk calculator to data available from a variety of national databases to assess the size of populations at various levels of risks across US communities. In the past, estimating the size of high-risk populations has been challenging because different factors contribute different magnitudes of risks, and the risk factors are not independent of each other. For example, not only are older adults more likely to die of the virus than younger adults because of their age, but they are also more likely to have heart disease, which makes them even more vulnerable. In the new study, the researchers define several levels of risks based on an underlying risk score and make projections for the size of populations exceeding those risk thresholds, accounting for both prevalence and co-occurrences of these factors. The researchers worked with PolicyMap to make this information publicly available in the COVID-19 Risk Maps.
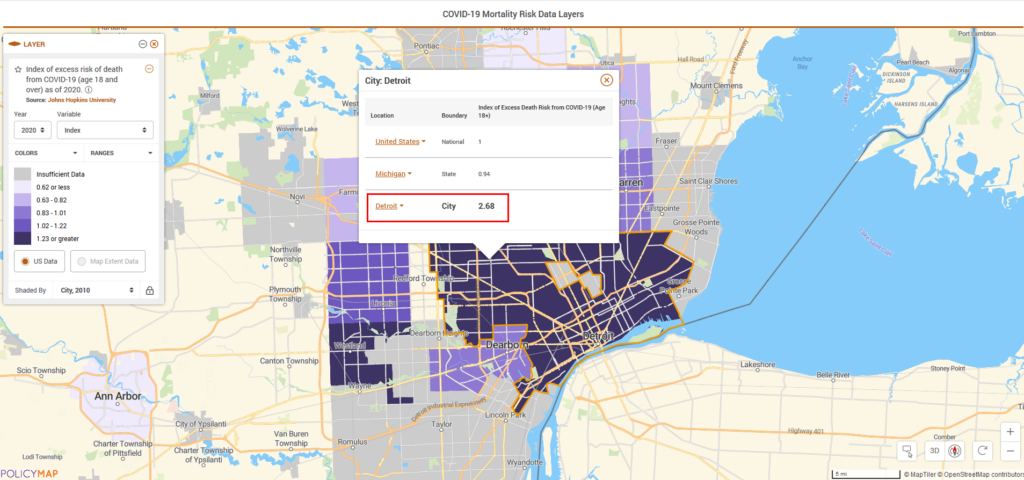
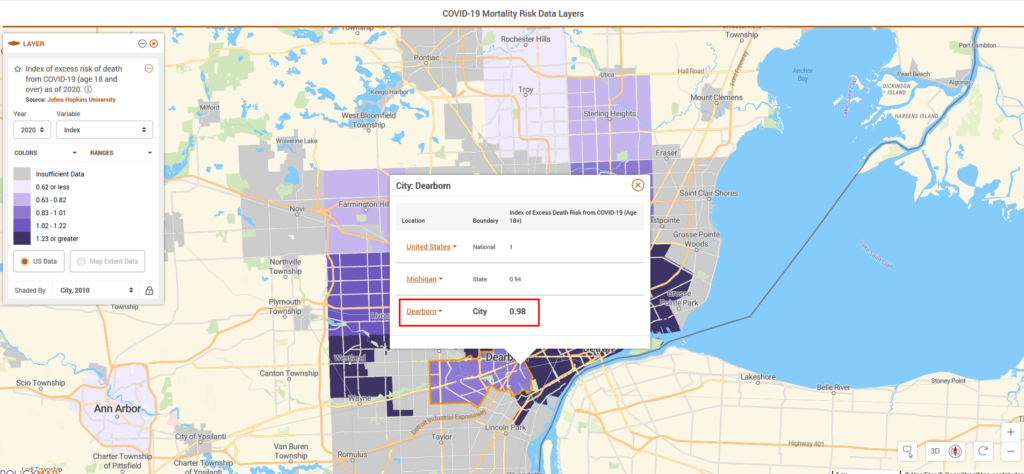
For example, the researchers estimate that due to a higher concentration of risk factors, residents of Detroit, on average, are at 2.68 times higher risk of dying from COVID-19 compared to the US national average. In contrast, Dearborn residents, on average, are at slightly lower risk than the national average.
Planning for vaccine distribution will require knowing how many doses of medication would make the most difference in a community. When a vaccine first becomes available, it is likely that it will be distributed in limited quantities at first. So how can this new research be used to target a vaccine to prevent the most loss of life?
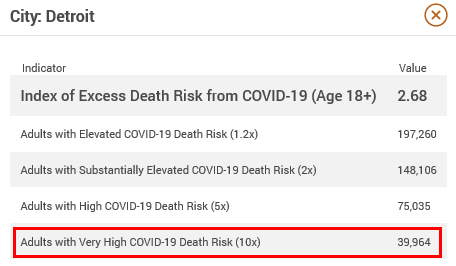
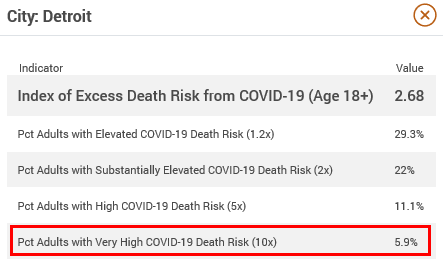
In Detroit, researchers estimate that nearly 40,000 adults, or roughly 6% of the adult population, are at 10-fold or higher risk of COVID-19 mortality compared to the national average.
Vaccinating this highest risk group could prevent up to 64% of projected COVID-19 deaths (the rate will depend in part on the efficacy of the vaccine).
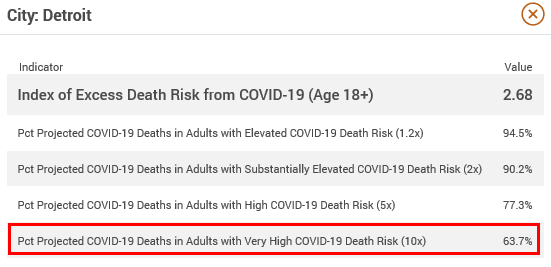
In other words, vaccinating only 6% of adults in Detroit could prevent nearly two thirds of COVID-19 deaths.
As more vaccine becomes available, those at lower risk thresholds can be targeted. In Detroit, an estimated 90% of COVID-19 deaths could be prevented by vaccinating 22% of Detroit adults, or less than 150,000 people.
Find your community’s risk level and assess effective strategies for saving lives using the COVID-19 Risk Maps.
About the Data
The researchers created the Mortality Risk Calculator based on a statistical model using data published from the UK OpenSAFELY study, combined with rates of mortality observed in the US associated with age and various racial and ethnic groups. The model and underlying projections are validated using recent COVID-19 mortality data.
Upon establishment of a robust statistical model of the role that various demographic, economic, and health factors contribute to COVID-19 mortality in individuals, the team used publicly available data from the US Census Bureau, the CDC, CMS, and more to create estimates of risk for communities. Community-level estimates are available for both the general adult population age 18 and older, and the Medicare population age 65 and older.
A manuscript describing the details of the study underpinning the Mortality Risk Calculator and the data in the COVID-19 Risk Maps is publicly available through medRxiv and is currently going through peer review.