
Did you know… (Updated: See Values)
Welcome to our series on helpful tips for PolicyMap. With over 10,000 indicators of data and many features, we hope our series can help users better utilize PolicyMap. For a complete training, please join a free online session here: Click Here
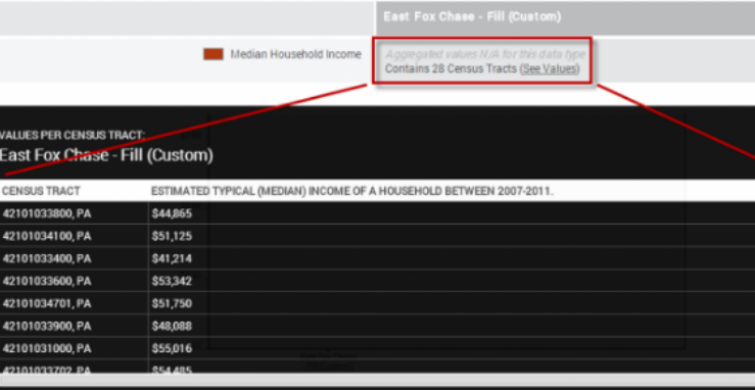
Did you know the See Values feature gives users the ability to download all the values of data for all the geographies that make up an area. Subscribers can download data for custom regions or geographies without an aggregated value. If your custom region displays an N/A as the value, the See Value function will then give you the ability to download the data for the geographies that make up the location. The See Values feature has some unique rules in relation to Custom Regions.

As a reminder, the See Values feature allows a user to download data for all of the geographies that make up a location. For example, you can download the population totals for each county in Oregon, or number of sub-prime loans for all the counties in Oregon.

The See Values function works in two unique ways for custom regions and pre-defined boundaries like school and state districts.
 If your location is larger than the smallest geography in the dataset, the See Values function will download the all the geographies contained within your location. (e.g. your location is a county and the data is available at the census tract level).
 If your location is smaller than the smallest geography available in the dataset, the See Values function will download the geographies that touches your location. (e.g. your location is a zip code and the data is only available at the county level).
If you wanted to know more about a feature or topic, send your request to info@policymap.com subject “Did you Know…”
![]()