
A Closer Look: Double Trouble?
Across the nation, 19% of all homebuyers who financed the purchase of a home in 2006 used a “piggyback” loan – that is, they used 2 loans at closing to purchase their home. This is up from 2005, when 17.6% did and from 2004, when 10.5% did. (Note: Our estimates are likely undercounts because they only determine piggybacks where the same lender originated both the first and second loans. Often times, two different lenders are involved.)
These loans, sometimes called “80/20s”, allow homebuyers to cover 80% of the sale price of the home with one loan and use a second loan to cover the remaining 20%. According to a recent TRF study of foreclosures in Maryland, piggyback loans often carry a higher interest rate than the primary loan and will oftentimes have a different term of maturity. Some borrowers may find this preferable as it allows them to avoid private mortgage insurance and purchase a home with “no money down” or to avoid exceeding the limits of the conforming lending market.
While piggybacks made it easier for some buyers to purchase homes, particularly as prices were rising, stories from around the country suggest that as home prices drop and owners struggle to make payments, those with piggybacks are being pushed into foreclosure. These stories suggest that as owners now owe more on their house than it is worth – negative equity – they can’t refinance or sell their home as a way to get out. (See “Piggyback Loans vs. Insurance, Washington Post, March 15, 2008)
For its mortgage foreclosure study in Maryland, TRF created a formula that when applied to Home Mortgage Disclosure Act (HMDA) data, could estimate when piggyback loans were used to purchase a home. TRF then applied this same formula to 2004, 2005 and 2006 HMDA data for census tracts across the nation.
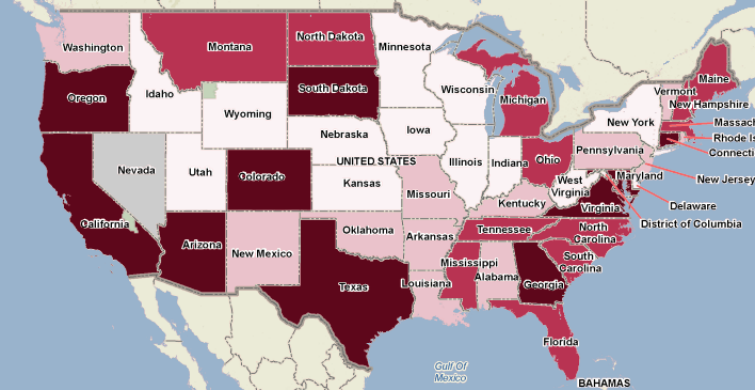
Across the nation, the top-ranking states for piggyback lending (as a percent of all home purchase loans) include:
|
Rank # |
Top 25 states for rate of piggyback lending |
Percent of Purchase Originations that were Piggybacks |
|
1 |
California |
31.55% |
|
2 |
Nevada |
29.70% |
|
3 |
Maryland |
26.99% |
|
4 |
District of Columbia |
26.46% |
|
5 |
Arizona |
24.85% |
|
6 |
Hawaii |
24.39% |
|
7 |
Oregon |
24.26% |
|
8 |
Washington |
23.52% |
|
9 |
Florida |
22.82% |
|
10 |
Rhode Island |
22.60% |
|
11 |
Colorado |
22.37% |
|
12 |
Utah |
21.98% |
|
13 |
Texas |
20.95% |
|
14 |
Virginia |
20.94% |
|
15 |
Massachusetts |
20.50% |
|
16 |
Georgia |
19.90% |
|
17 |
Illinois |
18.01% |
|
18 |
New Mexico |
17.39% |
|
19 |
New Hampshire |
17.28% |
|
20 |
Michigan |
17.27% |
|
21 |
Idaho |
17.21% |
|
22 |
New Jersey |
17.13% |
|
23 |
Connecticut |
16.53% |
|
24 |
Minnesota |
16.33% |
|
25 |
New York |
15.68% |
To see this data mapped and explore a specific geography, go to PolicyMap, select Mortgage Originations, and then Piggyback Purchase Loans from the Add Data Layer bar. Zoom in or use the Set Location bar to explore different parts of the country. Use the identify tool (you must be registered) and click on a shaded area of the map once to see the underlying values in an area.
