
What is the Economic Impact of COVID-19 in Your Neighborhood?

Data
Small Business Administration: Paycheck Protection Program (PPP) Loans
Source
Small Business Administration (SBA)
Find on PolicyMap
- Lending
- Small Business Loans
- PPP Loans Greater than $150,000
- Small Business Loans
As businesses closed at the beginning of the lock downs in 2020, concern grew that many of those businesses would never reopen. Already financially burdened businesses were left especially vulnerable to the impact of pandemic restrictions and changes in consumer behavior. Small businesses were of particular concern.
More than a year later, businesses have begun to reopen, and unemployment has dropped. When watching for signs of economic recovery, rely on data to track changes in your local economy. PolicyMap is a helpful resource for visualizing economic data beyond unemployment, such as business vacancy and, most recently, PPP (the Paycheck Protection Program) loan recipients.
Tracking the Impact on Brick-and-Mortar Businesses
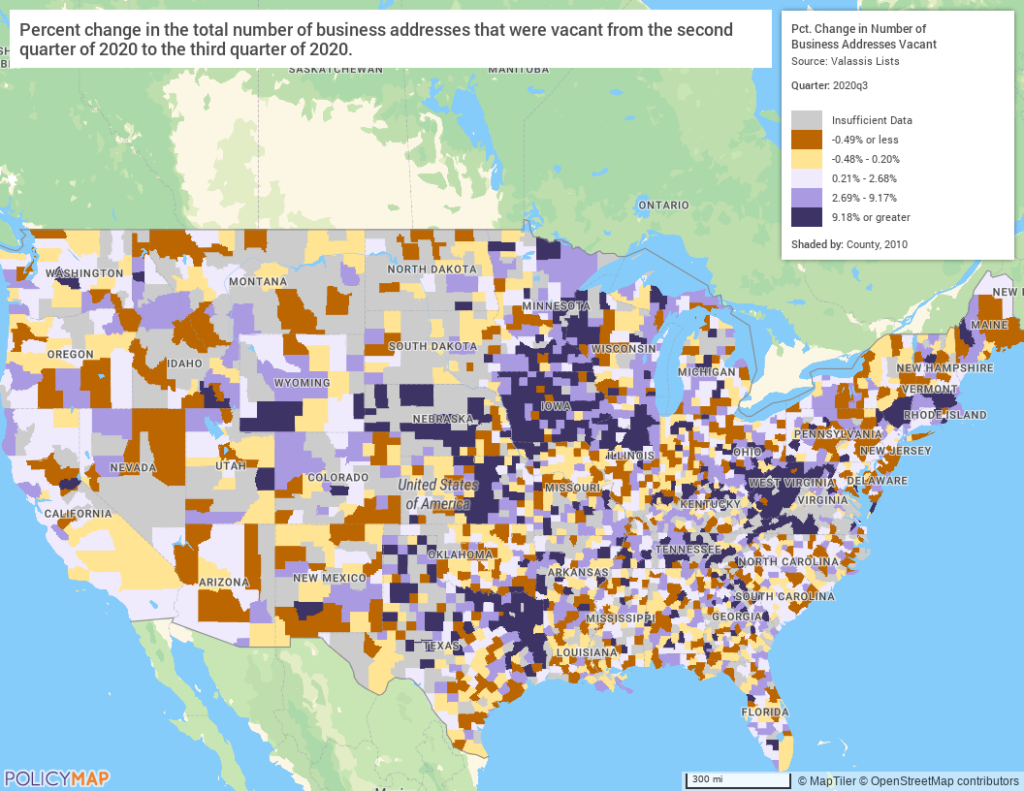
Data on business vacancy shows that some parts of the country may have experienced a greater decline in brick-and-mortar businesses and offices than others. The map below shows that counties in Iowa, West Virginia, and northeastern Texas experienced the steepest increases in business vacancy over the summer of 2020.
Paycheck Protection Program (PPP) And the Future of Small Businesses
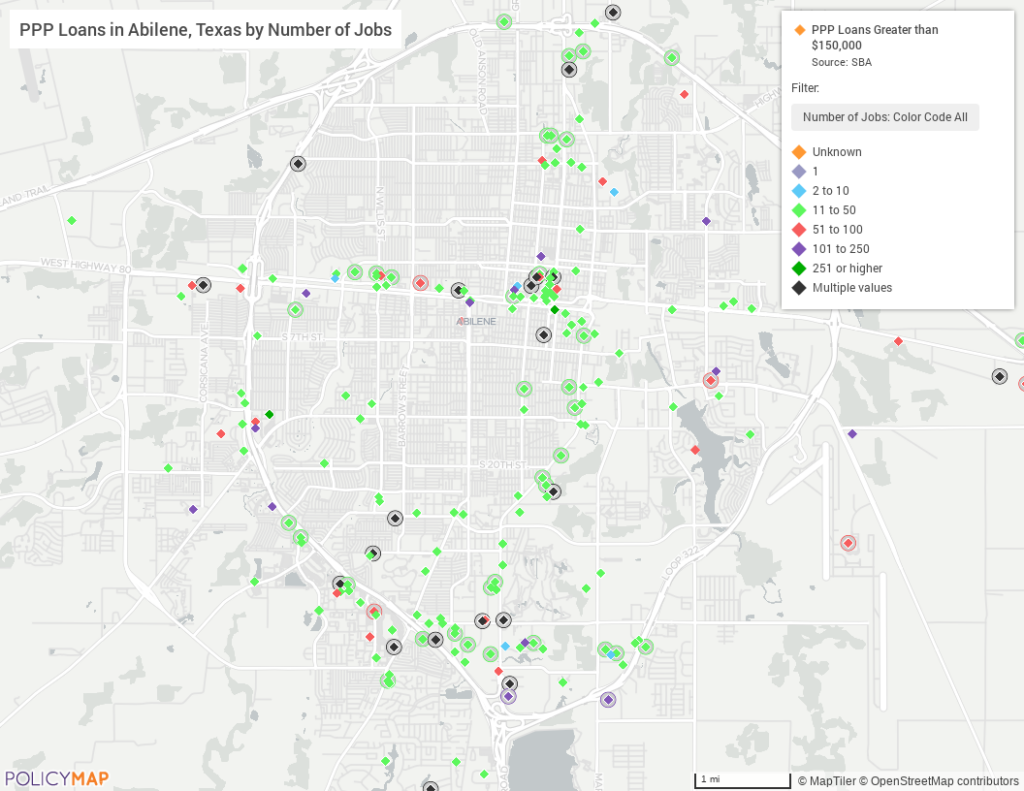
The Small Business Administration’s Paycheck Protection Program (PPP) was a forgivable loan program intended to help preserve jobs at small businesses, which in turn would help those businesses through the economic crisis. Now that the PPP loan program is closed and the SBA is busy granting forgiveness of those loans, we can examine the data on which businesses were most able to secure these loans. The loan level data contains information on the type of business, number of employees, loan amount and, in some cases, the gender and race of the owner. The map below, for example, shows that in Abilene Texas, most of the larger PPP loans went to businesses with between 11 and 50 employees.
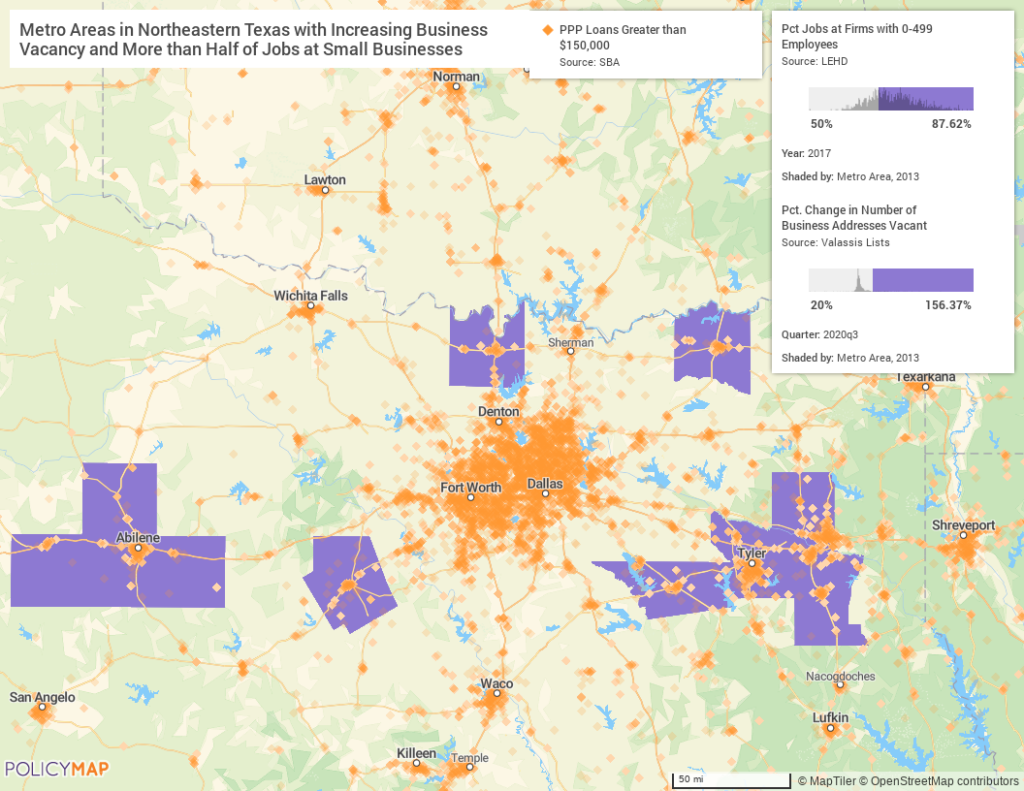
In northeastern Texas, the map below shows that many of the smaller metro areas surrounding Dallas/ Fort Worth experienced the highest increases in business vacancy, with more than half of jobs at small businesses. While PPP loans are clustered in some of these areas, the largest clusters of loans appear primarily in the immediate Dallas/Fort Worth area.
The pandemic is ongoing, and many small businesses are still in need of assistance. Data can help inform continued response to the COVID-19 crisis.
Understanding and evaluating the impact of the PPP loan program is critical, and tracking PPP investments and business closure could identify gaps in the program’s initial reach. Learning what prevented some qualified small businesses from securing loans may make similar programs more equitable and successful in the future.
Interested in using PolicyMap to dig deeper into the health of your local economy? Get in touch.