
Election 2020: Decided by People with Disabilities?
67.7 million Americans who either have a disability or have a household member with a disability are eligible to vote in the November 2020 elections, totaling more than one-fourth of the total electorate. If mobilized, those voters with disability-related concerns could influence or even determine election outcomes, according to a recent study from Rutgers University’s School of Management and Labor Relations. Despite this, the current presidential candidates have not directly targeted this constituency, and the needs of people with disabilities has not been a strong focus among either party’s campaign.
Perhaps one reason for a lack of attention paid by political candidates to people with disabilities is the nearly even split of political affiliations among people with disabilities. According to Pew Research Center, among people with disabilities in 2016, 42% leaned Republican, and 50% leaned Democrat.
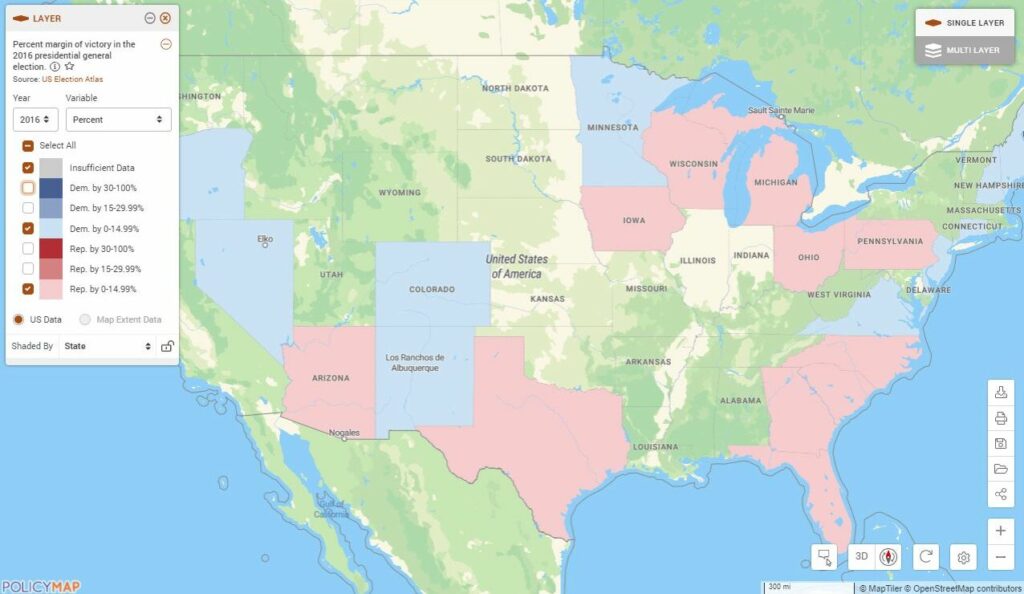
Therefore, it’s helpful to center the discussion about the influence of voters with disabilities in next week’s election on the 2016 presidential election results combined with what we know about the upcoming 2020 race. With Dave Leip’s U. S. Election Atlas data on PolicyMap, we can see states with the slimmest margins of victory for both parties in the 2016 presidential election, below, with light red indicating Republican, and light blue indicating Democrat:
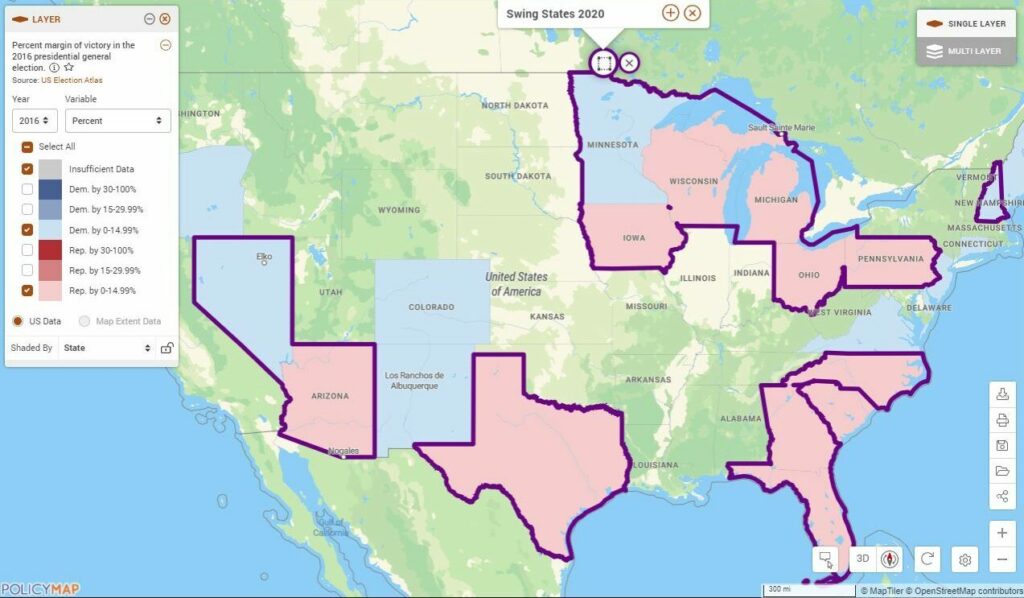
The latest polls from the Cook Political Report indicate that 2020 swing states include: Wisconsin, Iowa, Pennsylvania, Minnesota, Nevada, New Hampshire, Arizona, Michigan, Georgia, Ohio, Texas, North Carolina, and Florida. These states are outlined on the map below, layered over the 2016 smallest margins, by party:
Using the swing state outlines, we can then identify which swing states have the highest numbers of people with disabilities and which swing states could potentially be decided due to a strong turnout among that constituency:
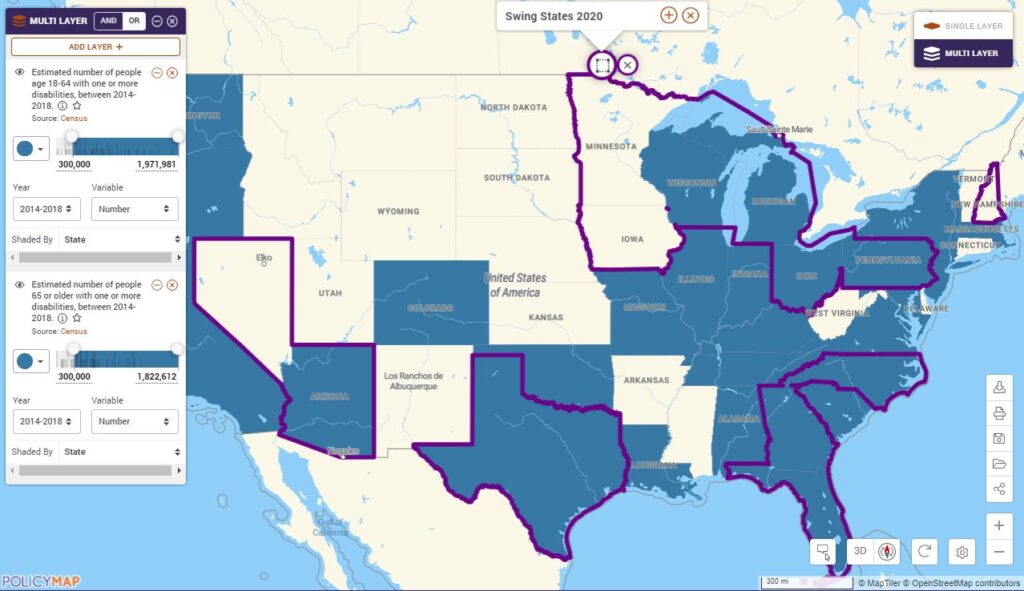
(Note: This map approximates voters, as it includes those of voting age with a disability, rather than eligible voters with a disability.)
The strength of this constituency hinges on turnout among people with disabilities and their relations. If activated, voters with disabilities or affiliations to those with disabilities could have a very strong influence on the outcome of the election in Arizona, Michigan, Wisconsin, Ohio, Pennsylvania, North Carolina, Georgia, Texas, and Florida, some of the potentially tightest battleground states.