
Elevating Opioid Awareness with PolicyMap

Data
Drug Overdose Deaths
Source
CDC
Find on PolicyMap
- Health
- Vital Statistics
- Mortality
- Drug Overdose
- Mortality
- Vital Statistics
With President Obama proclaiming this week as ‘Prescription Opioid and Heroin Epidemic Awareness Week,’ we decided to put together a blog post dedicated to how you can easily use PolicyMap to better understand the geographic nature of substance abuse and treatment to address opioid addiction.
Examining the Opioid Epidemic in PolicyMap
PolicyMap has a lot of data on issues related to substance abuse, overdoses, the opioid epidemic and treatment services. The key datasets include drug overdose deaths per 100,000 people from the CDC, and drug and alcohol treatment facilities and buprenorphine physicians both available from the Substance Abuse and Mental Health Services Administration (SAMHSA). Buprenorphine physicians are physicians who have been authorized by SAMHSA to treat opioid dependency using the opioid combatting buprenorphine medication. All of these datasets are available to the public on PolicyMap in the Health menu. The CDC drug overdose data is filed under Vital Statistics > Mortality and the treatment facility data is filed under Health Facilities > Drug and Alcohol Treatment Facilities.
Looking at these datasets together allows you to see counties that are facing the most severe impacts from drug addiction and overdoses and to identify the treatment resources that may be available or may be lacking in those areas. The drug and alcohol treatment facilities point data can be filtered to see those that treat opioid addiction, whether certain opioid abuse and overdose treatment medications are available (under “Type of Care”), the service setting, and even payment types accepted.
Opioid Epidemic Insights in PolicyMap
Examining the data allows you to draw some interesting insights. The maps below allow us to visualize the growing prevalence of drug overdose deaths in the Commonwealth of Pennsylvania from 2005 to 2014. Each map shows only those counties in the state with an overdose death rate greater than 20, which is the highest range available in the CDC data. The first map shows counties in 2005, the second shows counties in 2010 and the third map shows counties for 2014, the most recent year of data available. Just to provide some perspective, a death rate (per 100,000 people) of 20 is equivalent to the 2014 national death rate for diabetes and greater than the death rate for homicide, suicide and motor vehicle fatalities.
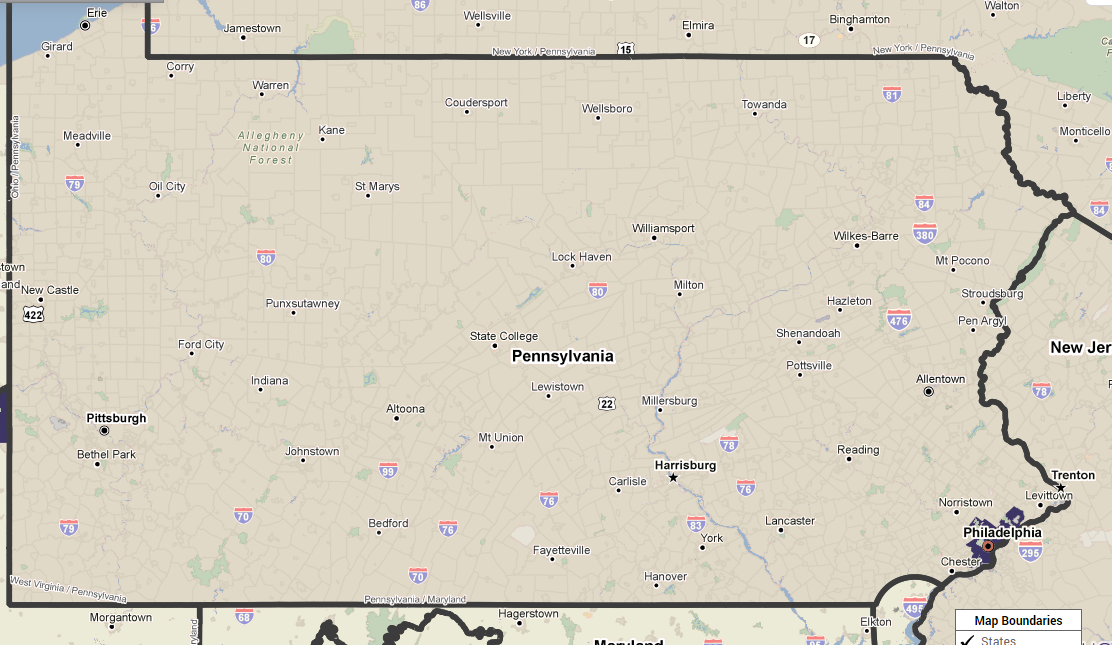
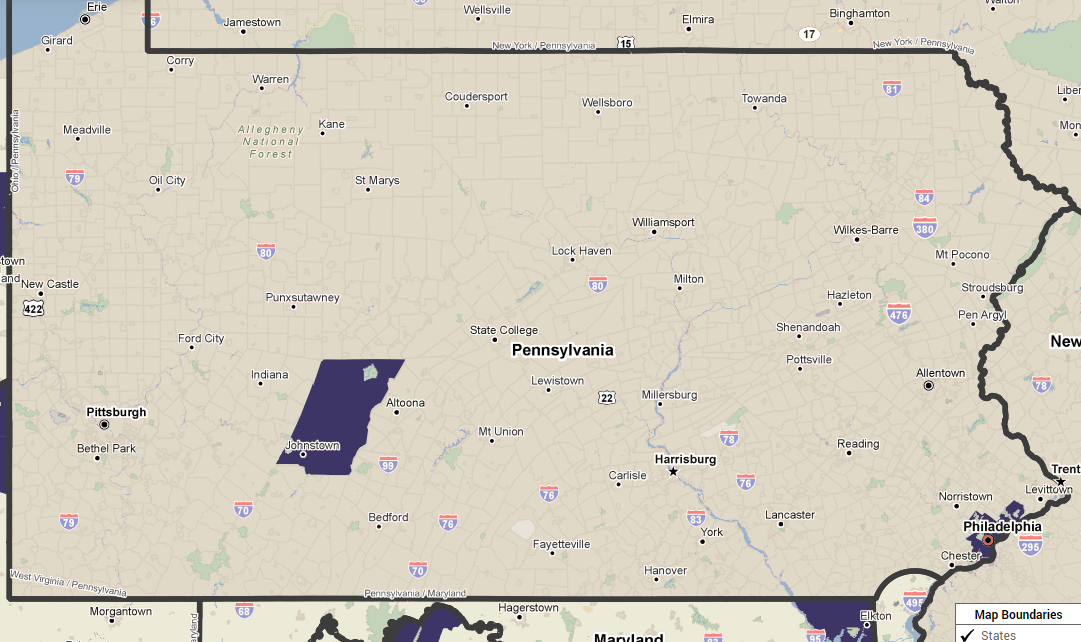
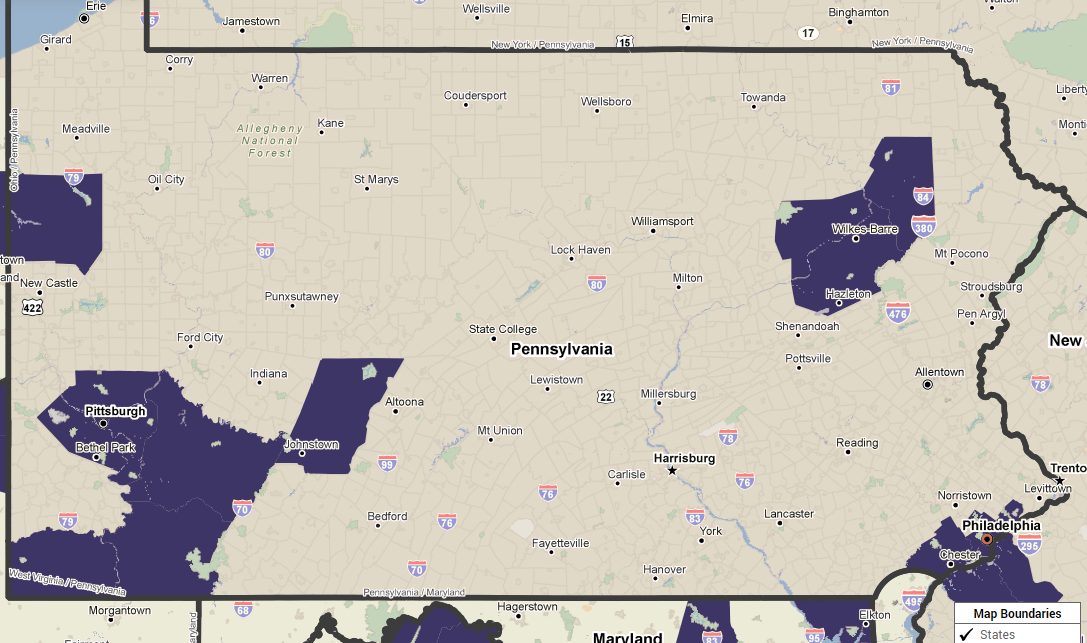
The most dramatic geographic spread in the overdose epidemic was observed between 2010 and 2014, showing that this issue has exploded in the last 5 years and is moving quickly. These maps also show that this epidemic is not isolated to specific geographies. You can see high overdose death rates in rural counties of southwest Pennsylvania, major cities such as Philadelphia and Pittsburgh and smaller metropolitan regions like Scranton Wilkes-Barre.
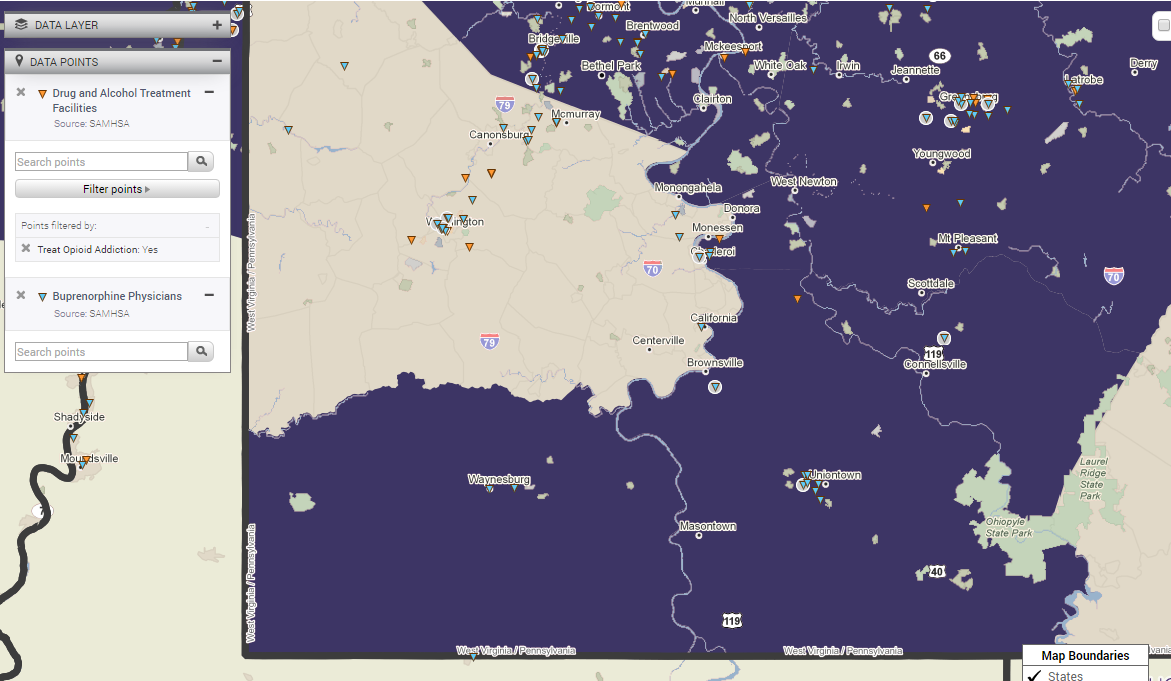
We can use the drug and alcohol treatment facilities and buprenorphine physicians point datasets to look at treatment resources available in these high need counties. Focusing on the southwest corner of the state, we can see that the majority of the drug and alcohol treatment facilities are concentrated in urban and suburban areas around Pittsburgh and that rural counties like Greene County on the border with West Virginia lack any treatment facilities that address opioid abuse.
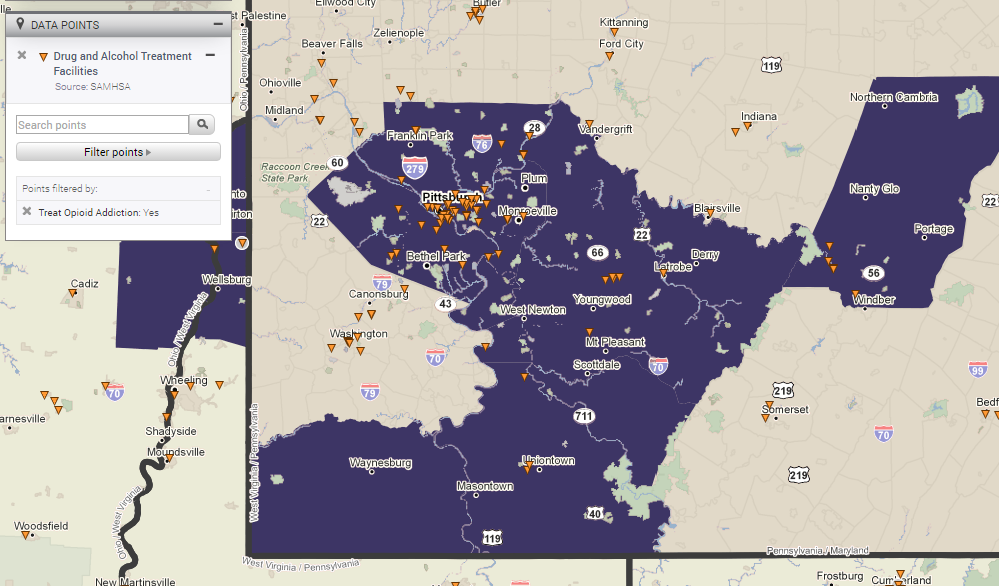
Adding the buprenorphine physicians dataset shows how these authorized physicians fill a rather desperate void in treating opioid abuse in more rural areas of the state.
Examining the attributes and applying additional filters on the treatment center points can allow you to draw more detailed insights based on treatment options offered and service settings. You can also add additional health facilities to your map like hospitals and community health centers to visualize other emergency treatment options that may be available.
Opioid Epidemic Awareness
The numbers around this epidemic are astounding. According to the CDC, since 1999, the number of overdose deaths involving opioids (prescription pain relievers and heroin) has quadrupled. At the current rate, almost 78 Americans die every single day from an opioid overdose. This crisis has prompted calls to action from agencies and leaders across the nation, including a recent letter from the U.S. Surgeon General to every doctor in the country.
We recently detailed our partnership with the USDA to visualize the opioid epidemic and potential treatment resources in rural America, which was highlighted in an announcement by the Secretary of Agriculture. The opioid epidemic is an issue that is at the forefront of the nation’s mind right now, and PolicyMap is proud to be able to offer a simple-to-use tool that can help policymakers, advocates and other interested citizens to better understand this complex problem.