
Everyone Likes Property Tax (Data)
Longtime readers of the blog know that we have a bit of an obsession with tax data. With our recent ACS update, we added a whole bunch of new indicators, and one of the most interesting is median real estate tax.
Property taxes are often loved by municipalities and hated by homeowners, because the taxes owed are relatively steady year-to-year, unlike income taxes. A low-wage earner is unlikely to have unpayable income taxes, but if they live in, say, an old family home, their property taxes could be anything, depending on the value of the home. If you’re a municipality, though, this could be a boon, as your local services (schools, fire, police, trash, etc.) have a constant source of revenue, even during times of high unemployment.
Some cities and states rely more heavily on property taxes than others, and this is plainly visible on the map:
It’s always fascinating when ACS data shows such stark contrasts along state boundaries. Usually, there aren’t significant demographic differences along state borders; southwestern Pennsylvanians aren’t very different than northern West Virginians. But once state laws come in, those similarities are thrown out the window.
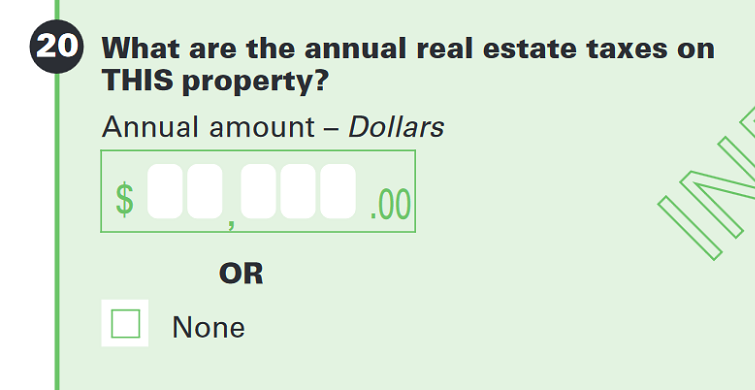
For the nitty gritty details on this indicator, here’s what ACS documentation has to say (from page 30 of this document):
The data on real estate taxes were obtained from Housing Question 20 in the 2014 American Community Survey (ACS). The question was asked at owner-occupied units. The statistics from this question refer to the total amount of all real estate taxes on the entire property (land and buildings) payable to all taxing jurisdictions, including special assessments, school taxes, county taxes, and so forth.
Real estate taxes include state, local, and all other real estate taxes even if delinquent, unpaid, or paid by someone who is not a member of the household. However, taxes due from prior years are not included. If taxes are paid on other than a yearly basis, the payments are converted to a yearly basis.
The payment for real estate taxes is added to payments for fire, hazard, and flood insurance; utilities and fuels; and mortgages (both first and second mortgages, home equity loans, and other junior mortgages) to derive “Selected Monthly Owner Costs” and “Selected Monthly Owner Costs as a Percentage of Household Income.” These data provide information on the cost of home ownership and offer an excellent measure of housing affordability and excessive shelter costs.
Besides looking at state-to-state differences, it’s really interesting to see some of the differences at the local level. Here, you can see how taxes in Philly compare with its suburban surroundings:
Property tax data isn’t actually new to PolicyMap. If you’ve been as interested in the IRS Statistics of Income tax data as we have, then you may have noticed that that dataset also has an indicator on property taxes paid. There are key differences between the data from these two sources. The IRS data comes directly from the filed tax returns, so it’s not reliant on self-reported data in the ACS survey. Additionally, each time frame is a single year, as opposed to the ACS data which comes in as a five-year average.
However, the IRS isn’t actually reporting the amount of local and state property taxes paid, it’s reporting the itemized deductions taken for property taxes. Many low-income earners and homeowners without mortgages are unlikely to report their property taxes as an itemized deduction, since they’re taking the standard deduction. The ACS is reporting data for all homeowners, not just those taking the federal tax deduction.
It’s important to note that the taxes being reported here are assessed by an assortment of entities, which can be different in different locations. Comedian John Oliver recently took a deep dive into special districts, which he argues don’t always have the oversight you’d want from a tax-collecting agency. If you’ve made it this far into this post, you should probably watch the video.