
Understanding FEMA Disaster Declarations
Natural disasters are “in” right now. Hurricane season is picking up, people in New Orleans and across the globe are commemorating the tenth anniversary of Hurricane Katrina, and residents of the West Coast are growing increasingly anxious about the next big earthquake. A recent feature in the New York Times visualizes the physical and economic impact of natural disasters throughout the country.
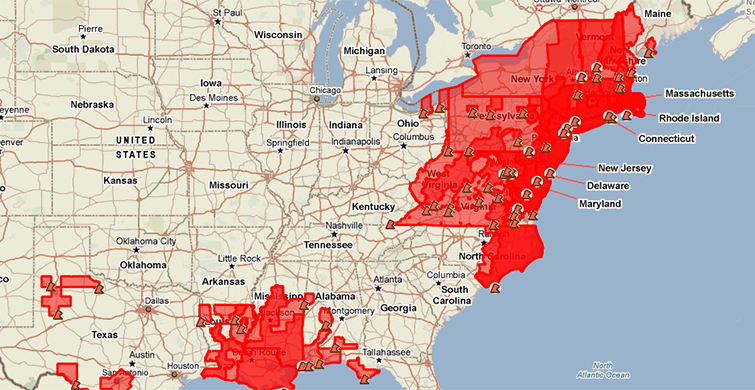
We’ve added the locations of federally-declared disaster areas to PolicyMap, and we hope this new data makes it easier to look at natural and man-made disasters in a policy context. These designations are from the Federal Emergency Management Agency (FEMA). They are represented as polygons made up of clusters of counties and American Indian/Alaska Native Areas/Hawaiian Home Lands where state governments have requested and received federal aid for a disaster. Disasters from the past five years (2010 – 2014) are included on PolicyMap in the Quality of Life menu. The map below shows floods:
How is a disaster area declared?
FEMA’s Disaster area declarations can’t be described simply as the locations of natural and man-made disasters. The process of making a declaration happens over multiple years:
- First, a disaster occurs – Oh no! An area experiences flooding, tornado, chemical spill, or another such event.
- The governor of the state where the disaster occurred then requests aid federal aid from FEMA by submitting a damage assessment as well as an estimate of how much money the state will spend on alleviating the disaster.
- The President will then declare a disaster or emergency, which allows the state to access programs for individual assistance, public assistance, and/or hazard mitigation.
- A disaster is then “closed out” when assistance through federal programs is complete and all funding streams have been exhausted.
FEMA Disaster declarations for major disasters are routinely open for years, and sometimes over a decade. Disaster area declarations related to Hurricane Katrina remain open ten years later, and Hurricane Isabel, 9/11, and the 1994 Northridge Earthquake have yet to close out.
Mapping disaster areas can be difficult, because the area directly damaged by the disaster is usually smaller than the area for which an official disaster is declared. Because states must consider the economic impact of a disaster along with physical damage, adjacent counties are often also eligible for program funding. On average, over 100 disasters were declared annually from 2010 to 2014. The map below shows 25 separate disaster areas declared in 2012 and 2013 because of Hurricane Sandy (Sandy occurred in late 2012, and some disaster areas were not approved until the following year):

In addition to visualizing the annual impact of major disasters on a regional scale, PolicyMap users can add one or more of these areas to a table to calculate the number of people and jobs within the disaster’s fiscal footprint. FEMA-declared disaster areas may also be eligible for additional federal investments such as New Markets Tax Credits and HUD Disaster Housing Assistance Grants. Even though the world is subject to a continual array of hazards, FEMA disasters will be updated annually on PolicyMap.