
The “Forgotten Middle”: Using PolicyMap to Support Middle Neighborhoods

Why the ‘Forgotten Middle’ Matters
Rent or electric bill? Food or prescription drug? For too many hardworking households, impossible decisions like these are a way of life. These families, often members of the “forgotten middle,” reside in middle neighborhoods, places that are neither thriving nor in crisis but are at risk of decline. Despite their importance, middle neighborhoods receive little policy attention and investment. Expanding affordable homeownership in these areas is essential to stabilizing neighborhoods, building community wealth, and advancing equity.
Defining the “Forgotten Middle”
The National Community Stabilization Trust (NCST) defines middle neighborhoods as those that are neither clearly healthy and thriving nor overtly distressed. These neighborhoods often include ALICE households – individuals who are Asset Limited, Income Constrained, and Employed – living on the financial edge and facing challenges that mirror the precarious balance of middle neighborhoods. These neighborhoods are home to millions of middle- and working-class families in cities and suburbs across the country. However, there is no universal definition of a middle neighborhood, making targeted intervention difficult. As noted in Governing.com’s article, America’s Forgotten ‘Middle Neighborhoods’ by Paul C. Brophy and Ira Goldstein, “An estimated 46 percent of the nation’s urban population lives in a category of neighborhoods that local governments pay little attention to.” Yet, stabilizing middle neighborhoods is far less costly than attempting to revitalize areas after they have fallen into distress.
Identify and Support the “Forgotten Middle” Neighborhoods
PolicyMap’s mapping platform and robust data and analytics tools help local governments, housing and community development organizations, lenders, and policymakers better understand middle neighborhoods and create targeted solutions. Here’s how:
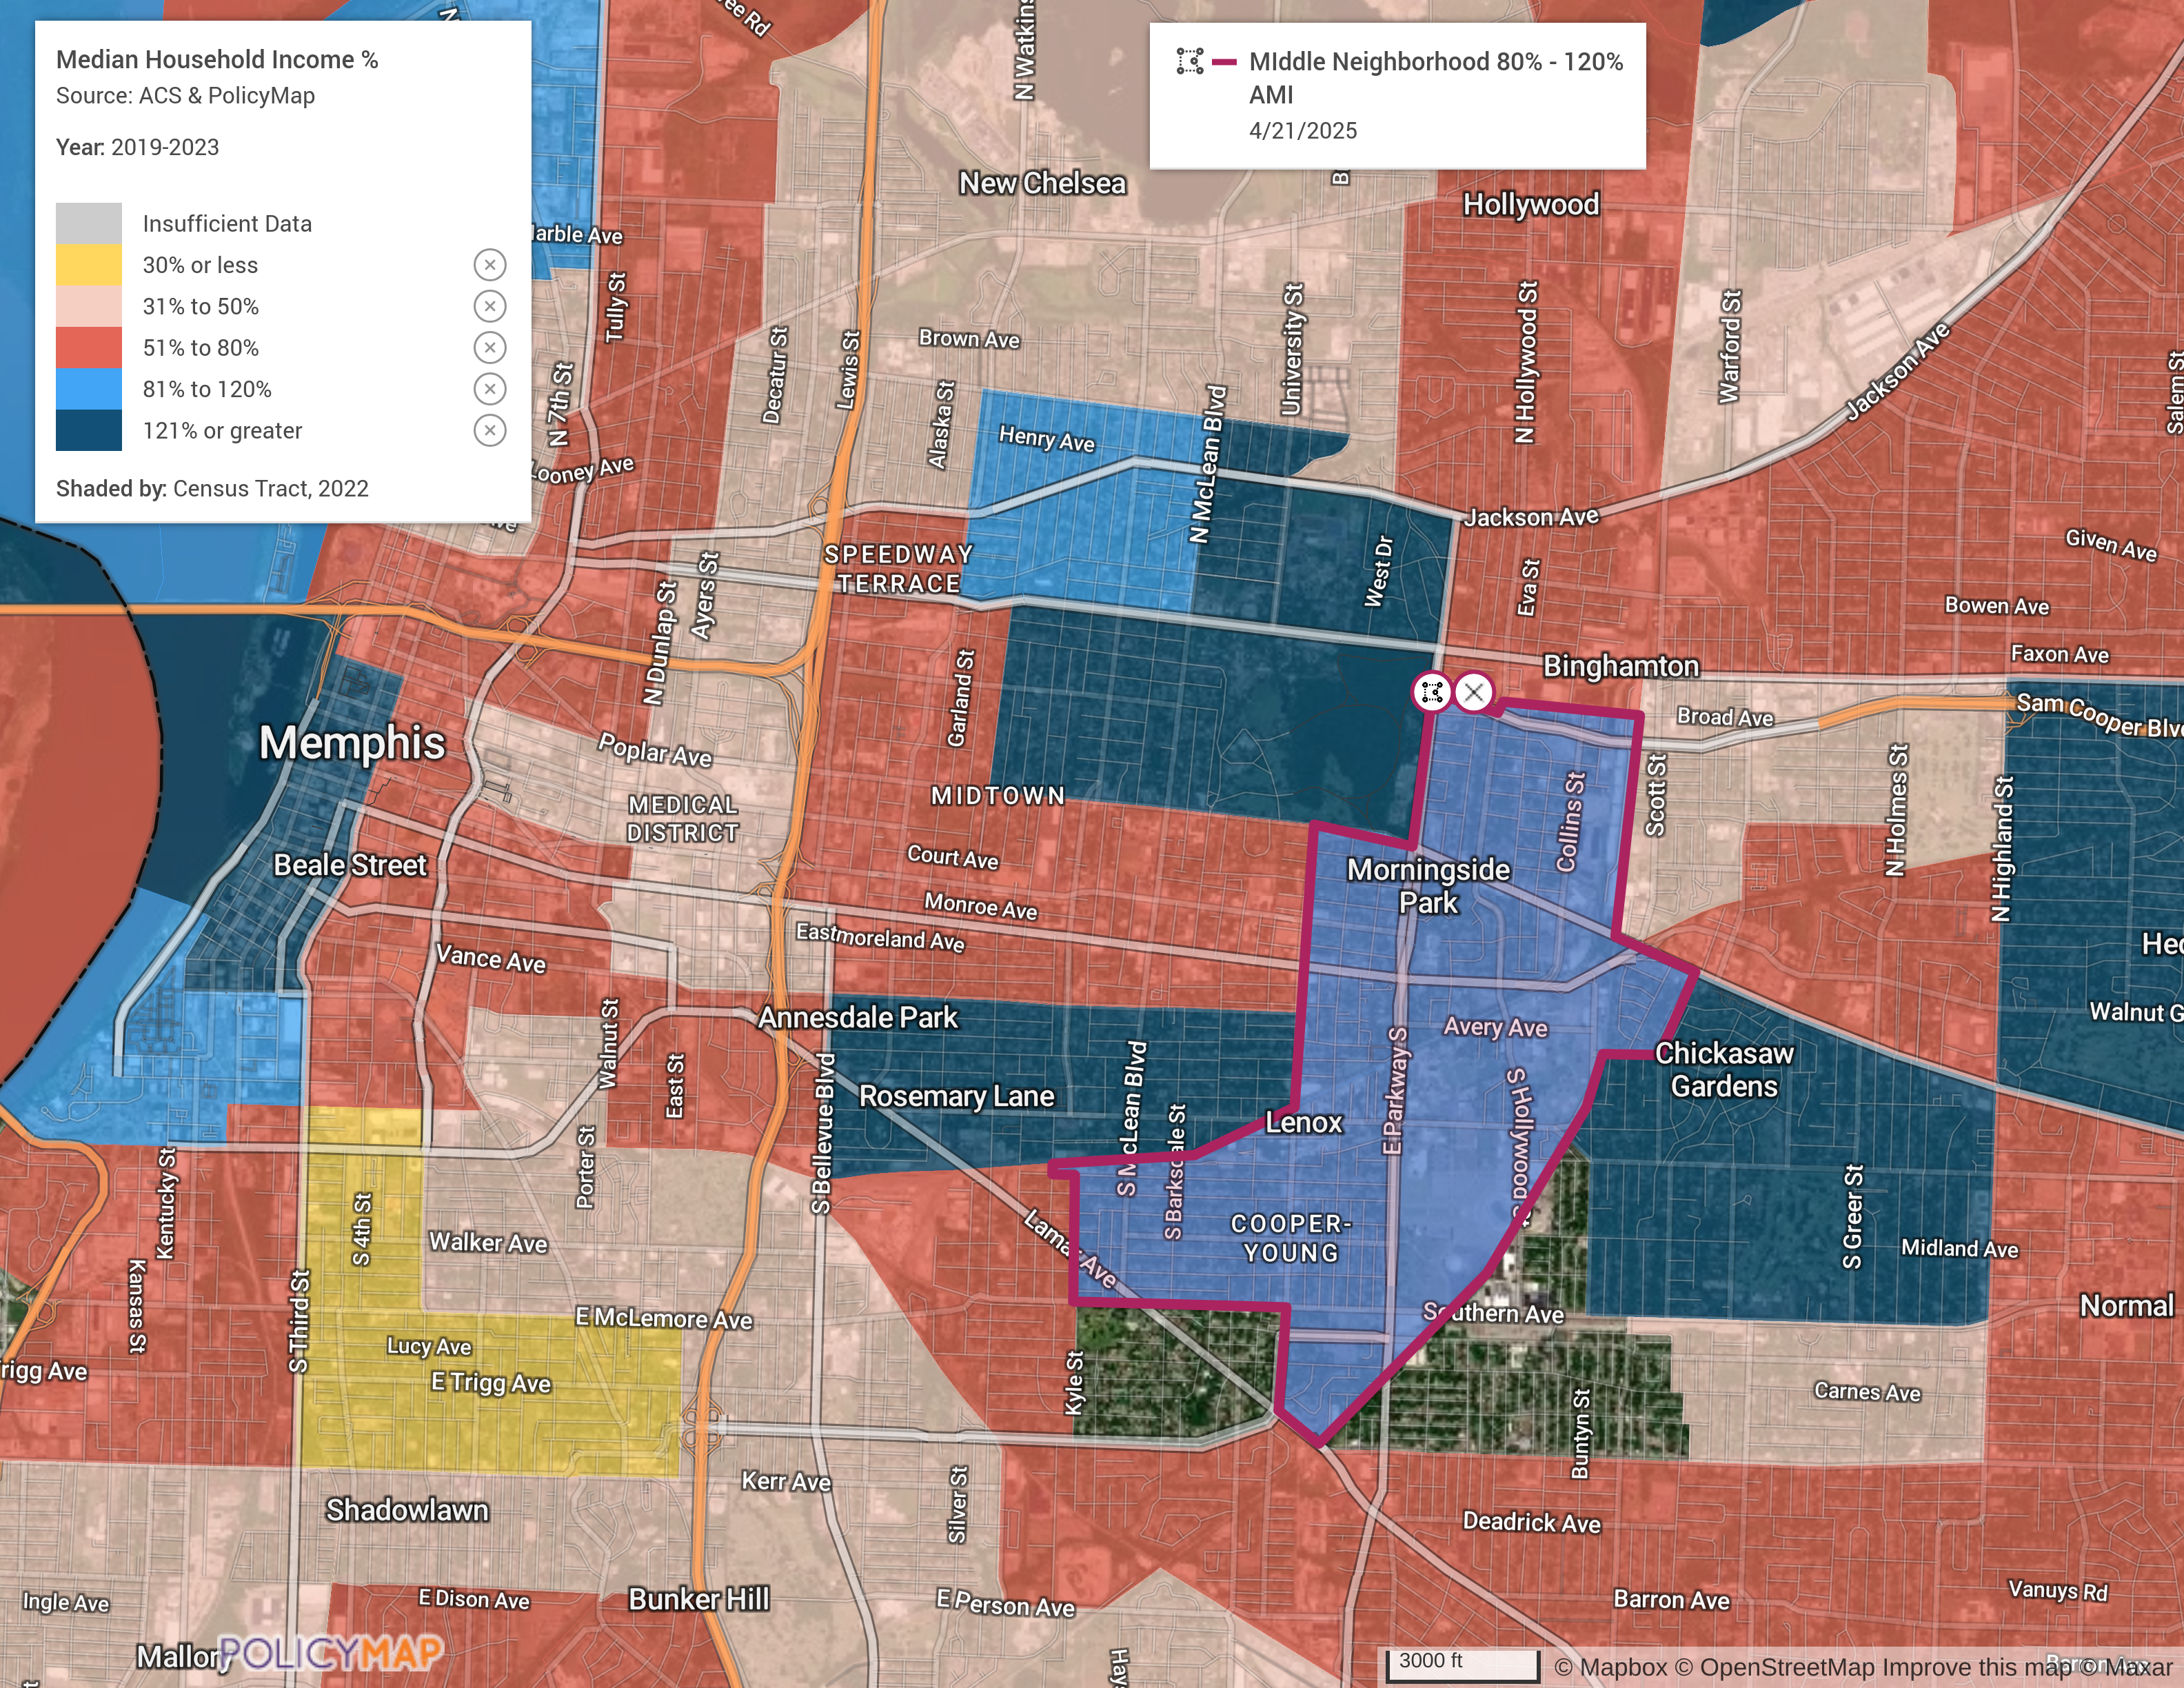
Locating Middle Neighborhoods
Using Memphis, TN, as an example, we illustrate how PolicyMap’s data and mapping tools can pinpoint middle neighborhoods. Through a combination of maps and tables, we highlight key metrics that define these vital but often overlooked areas.
Starting with Multi-Layer Maps, we identified Census Tracts that meet the following four criteria:
- Local median household income is between 80% and 120% of area median income (AMI) – these would typically be considered “moderate income” areas;
- Where at least 50% of households are homeowners;
- Where at least 25% of the workforce have some college or an Associates Degree;
- Where the population has decreased by no more than 5% between 2010 and 2020.
The map below shows values for one of the Census Tracts identified, which has seen a 5.5% increase in population during this period and meets our other criteria:

Viewing this same area against a general population change data layer shown below, the selected tract (shown in dark purple) is surrounded by neighborhoods that have seen a population decrease between 2010 and 2020.

Digging deeper into the selected tract, our Community Profile Report provides a comprehensive overview in terms of demographics, housing, jobs, and more, such as:
- Household Income Diversity: Analysis of annual income by census tract to assess economic variability. This area represents households at all income levels and demonstrates relatively high income diversity.

- Stability of Vacancy Rates: Comparing vacancy rates by census tract to county-level data to evaluate housing market stability. This area has half the vacancy rate of the county overall.

- Cross-Representation of Jobs by Industry: Understanding the diversity of employment sectors in the focus area. This area represents a diverse workforce, but also has a high concentration in Professional, Scientific and Technical Services employment relative to the state

From an income perspective, how does the Area Median Income of the focus neighborhood compare to surrounding areas? The light blue area with maroon outlining represents a bridge between lower income areas (shown in red) and higher income areas (shown in darker blue).
Monitoring Change Over Time
Use PolicyMap to track economic and demographic shifts, identifying early warning signs of neighborhood instability. Trends in property values, mortgage lending activity, and employment accessibility can indicate whether a neighborhood is strengthening or slipping into distress. For instance, the map below shows a modest increase in homeownership rate in our focus area, but significant decreases in surrounding areas such as the nearly 14% decrease in the area just to the North, shown here:

Supporting Policy and Investment
Policymakers and community leaders can use PolicyMap to advocate for resources, ensuring that middle neighborhoods receive the support they need. Data-driven strategies can encourage lenders and foundations to provide targeted loans, while cities can implement strategic investments in public infrastructure and resident-led neighborhood marketing initiatives.
Strengthening Middle Neighborhoods for the Future
Middle neighborhoods are essential to urban stability, but they need intentional investment to remain vibrant. PolicyMap provides the insights necessary to create, monitor, and report on initiatives that support homeownership and neighborhood revitalization in these areas. By leveraging data, stakeholders can ensure that middle neighborhoods continue to serve their vital role in fostering community wealth and advancing equity. Investing in the forgotten middle is an economic necessity for the long-term health of American cities.
The ACS is one of the most comprehensive datasets available, covering thousands of topics shaping American society. From economic trends to housing conditions, this wealth of data empowers policymakers, researchers, and everyday users to make informed decisions that drive meaningful change. PolicyMap enables users to create maps, visualize trends, generate Community Profiles, and download ACS and Census data for any U.S. neighborhood, city, county, or region.
Request More Information
Middle neighborhoods may be overlooked, but with the right data, they don’t have to be forgotten. PolicyMap equips decision-makers with the tools to locate, understand, and support these communities before they slip into distress. Want to see how our platform can help you take action? Request a demo and data walk-through by completing the form below.