
From Ratings to Reach: Visualizing School Performance with Niche

New School Performance Data from Niche Now Available on PolicyMap
PolicyMap is excited to announce the addition of new school performance data from Niche, now available to all subscribers. This release includes two key components: a point dataset with detailed school ratings and a layer dataset showing the distance to the nearest high-performing public school. Together, these datasets offer a deeper look at school performance across the country.
Niche Data Overview
Niche is a platform that ranks schools using public data and user reviews. PolicyMap licenses Niche ratings for Pre-K through 12th grade schools. The Overall Rating and Academic Rating are based on Niche’s proprietary algorithms, which use a grading scale from A+ to D-.
Niche’s methodology includes a Bayesian adjustment to account for confidence in user-submitted data, standardized z-scores for comparison, and factor weighting based on both statistical analysis and user priorities. Schools missing over 50% of the weighted factors are excluded from rankings or only receive a grade to ensure reliability. More information about Niche School Ratings can be found here.
What’s Included on PolicyMap?
Point Dataset: School Performance
The point dataset includes detailed data for individual Pre-K through 12th grade schools, with a wide range of available fields. Key indicators include:
- Niche Overall and Academic Ratings (A+ to D-)
- Percent proficiency in math and reading
- Graduation rates
- Average high school GPA
- Average SAT and ACT scores
- AP course offerings and exam pass rates
Additional data cover enrollment, school type, demographic composition, and other academic performance measures, including user-reported statistics where available.
Layer Dataset: Distance to Nearest High-Performing Public School
This layer represents the average distance (in miles) in each census tract to the nearest public school with a Niche Overall Rating of A+ or A. The calculation is based on the center points of majority-land block groups within each tract, and for block groups with over 50% water area, block-level center points were used instead. Areas where all eligible block groups are located more than 50 miles from any A+ or A school are labeled “Insufficient Data.”
Interpretation Notes:
- This layer includes only public schools rated A+ or A, while the point layer filter shows schools rated A+, A, or A-. Keep in mind that A- schools are not included in the distance calculation.
- A tract may show an average distance even if no high-performing schools are within its boundaries, as the metric reflects proximity, not presence.
Analyze School Performance with PolicyMap
The new datasets provide valuable opportunities to explore access and equity in school performance. Here are two examples of how these datasets can be used:
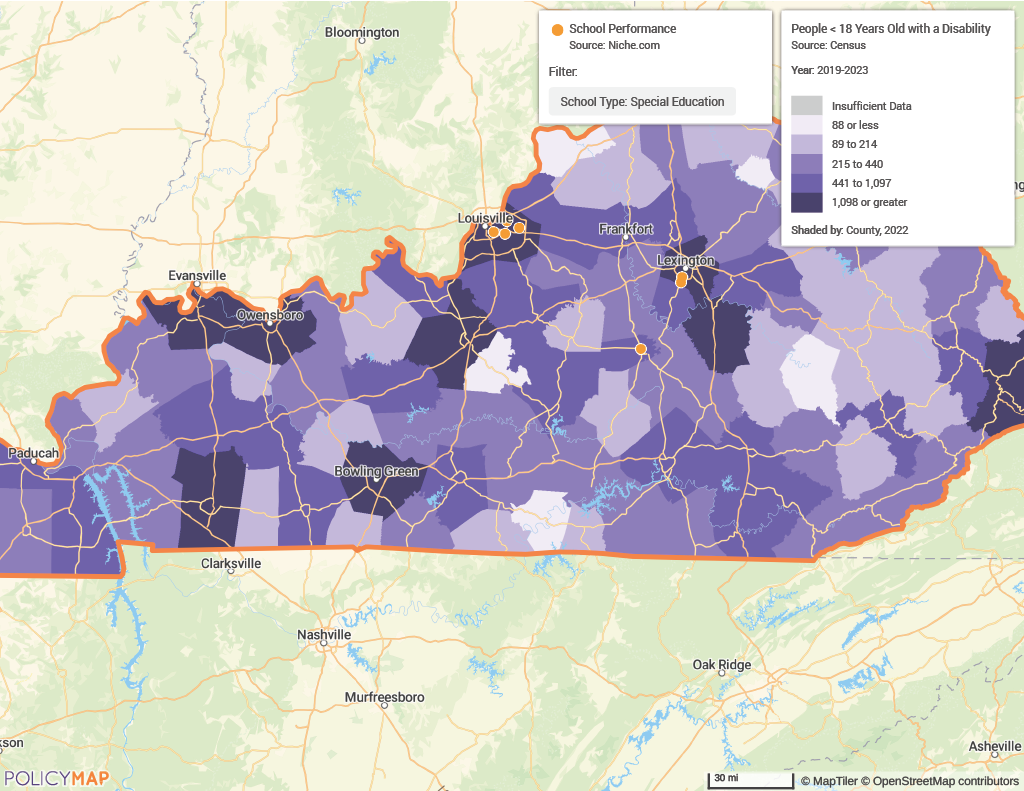
Access to Special Education Schools
The School Performance point dataset was combined with filters for special education schools and demographic data on children under 18 living with a disability. This analysis helps to identify potential gaps in access to specialized educational services.
For instance, a map of Kentucky reveals that special education schools are concentrated in Louisville and Lexington, leaving large areas of the state with limited access despite notable populations of children with disabilities.
Transportation Barriers to High-Performing Public Schools
The Distance to High-Performing Public School dataset was overlaid with the percentage of housing units without a vehicle. By filtering areas where the nearest A+ or A-rated public school is more than 30 miles away and where over 10% of households lack access to a vehicle, significant disparities in school accessibility were identified.
An example near Beattyville, Kentucky shows a rural area where families without cars face challenges accessing top-performing public schools. This analysis highlights how physical distance and limited transportation options can exacerbate educational inequities.

Where to Find the School Performance Data?
Both the point and layer datasets are available to all subscribers in the Education > School Rating Performance menu on PolicyMap. Happy exploring!
Creating multi-layer maps can be useful in visualizing resource gaps, exploring the correlation between homelessness and other social determinants of health, seeking potential opportunities for collaboration, and so much more.
Request More Information
Visualize educational access, uncover geographic disparities, and power your planning with new insights. Fill in the form below to request more information about new school performance data from Niche.
Why the Change from GreatSchools?
Niche is replacing GreatSchools, with key differences including the incorporation of data on school demographics, administrative details, graduation rates, AP course offerings, etc. Niche also includes user-reported data on metrics such as average GPA, SAT/ACT scores, and AP exam pass rates. With Niche’s broader data, we expanded the point dataset filters and created separate distance-to-school layers for Pre-K, elementary, middle, and high schools.
While GreatSchools offered more granular data on state-level standardized tests, Niche shifts the focus to broader measures of academic proficiency and school experience—providing a different lens through which to explore school performance.