
Homeowner and Renter Affordability

Among the exciting PolicyMap data updates of the summer season includes a housing and rental affordability update. This is a key issue of concern because, while it is generally considered reasonable for a family to spend 30% of its income on housing, a number of factors have made achieving this level of housing affordability increasingly uncommon. Now, under the Owners and Renters tab, PolicyMap users can find homeowner and renter affordability calculations for 2009 (in addition to 2000 for homeowner affordability).
Housing affordability has been a growing concern since around 1970 when the gap between income and housing prices began to steadily increase. According to some researchers, while housing prices increased by as much as 83.2% from 1970-2000, median income rose by a paltry 26.2%, causing both renters and owners to have to spend increasing fractions of their income on housing. Although this affects homeowners and renters alike, it is the latter who suffer the most, making it a particularly important policy concern given that the ongoing foreclosure crisis continues to turn many former homeowners into renters.
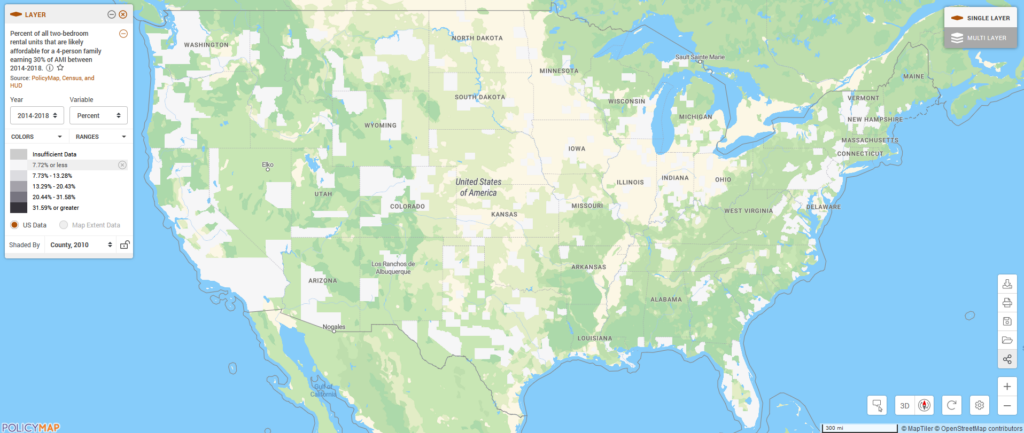
As seen in the map below, renter affordability has become highly elusive for very low-income families. On the west coast and throughout the east especially, there are a high number of areas where less than 5% of the rental units available are affordable for a 4-person family living on 30% of the average median income!
While very low-income families continue to face the deepest challenges with housing affordability, the recession has made this a more widespread issue for people of varying income levels. In fact, the map below reveals that on the east and west coasts, nearly 1/5 of rental units are not even affordable for families earning 100% average median income.
According to the Joint Center for Housing Studies at Harvard University, among the factors making a household more likely to be cost-burdened are whether a family owns or rents, race, education level, employment status, age (elderly and student populations are most vulnerable), and whether the household is located in a metropolitan area. Housing affordability causes families to face difficult tradeoffs, with cost-burdened households spending “40% less on food, nearly 50% less on clothes and healthcare, and 30% less on insurance and pensions than families living in affordable housing” (Joint Center for Housing Studies, 29).
Some argue that with renter incomes falling and rents rising, the response from the federal government has been too limited, with the only significant growth coming from the LIHTC program (adding approximately 100,000 affordable units/year). To read more about housing affordability challenges facing owners and renters, check out chapter 6 in The Joint Center for Housing Studies’ recently released The State of the Nation’s Housing 2012 report.