
Matching Hospital Capacity to Risk for Severe COVID-19 Response

Data
Intensive Care Unit Beds
Source
Kaiser Health News
Find on PolicyMap
- Health
- Access to Medical Care
- Health Facilities
- Access to Medical Care
As the COVID-19 pandemic unfolds in the United States, government agencies and institutions are taking a hard look at hospital capacity for the surge in anticipated severe COVID-19 cases. We don’t need to look far to know that the surge will happen (and is already happening in some places), having watched the painful progression of the epidemic in Italy and elsewhere. Despite Italy’s highly ranked healthcare system and effective responses to the pandemic that include free and widely available COVID-19 testing, hospitals in Italy are staggering with the load and having to make hard choices about prioritizing patients with better prognoses.
And now sources are saying that the U.S. may become the next center of the pandemic. The comparative ranking of the U.S. healthcare system, paired with what many experts believe has been a slow national response, positions us to face steeper challenges, perhaps similar to those of Spain. We can identify communities in the U.S. who are at the greatest risk of overwhelming their limited hospital resources with demand due to concentrations of people at risk for severe COVID-19. Strategically targeting those places most likely to become overwhelmed can help in siting overflow facilities and maximizing forthcoming federal aid directed to health care institutions and public health departments.
To understand which hospitals and communities will likely be overtaxed and where the problems will likely be most pronounced, we recently added hospital bed count data to consider in relation to communities with severe COVID-19 risk factors. Those factors include older (65+) populations, and local rates of chronic health conditions such as COPD within hospital referral regions. Adding hospital locations to the map, it’s clear that many healthcare facilities will need additional outposts to serve severe COVID-19 patients if the spread continues as predicted.
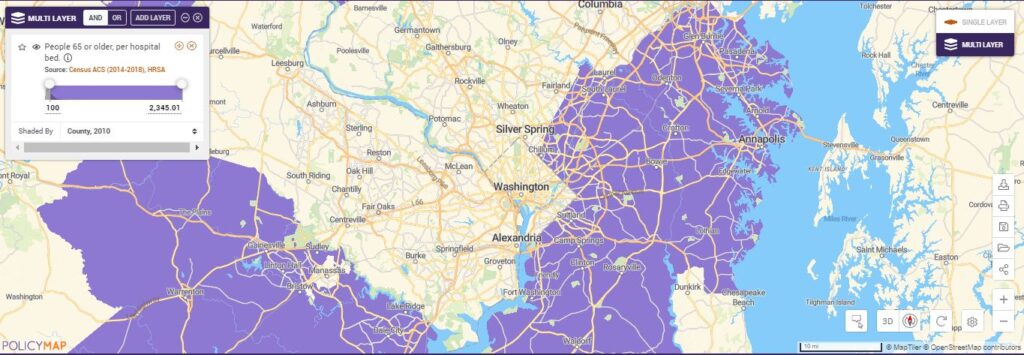
Using PolicyMap’s (BETA) Multi-layer Maps we can see where there’s a shortage of hospital beds. The purple places on the map may have severe shortages as there are more than 100 people age 65+ per bed.
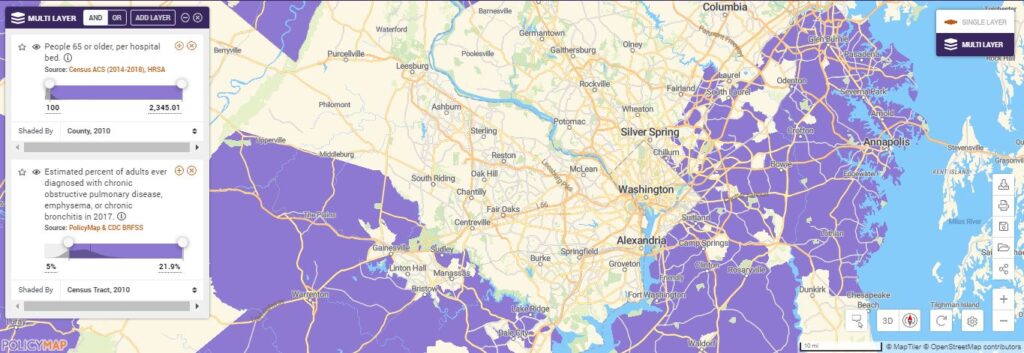
Overlaying higher COPD rates, we can see the places in purple with fewer hospital beds where potentially more severe COVID-19 cases could concentrate.
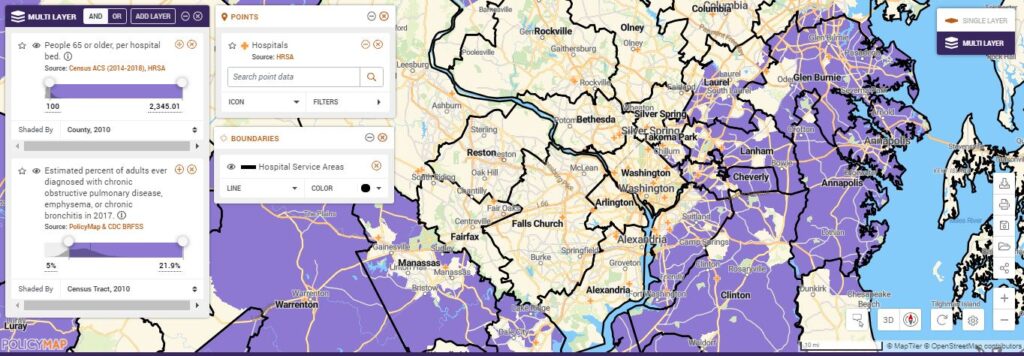
Adding hospital locations and hospital service areas we can identify the areas within hospital service areas that potentially face overwhelming demand, informing where to site additional supports like testing centers and field hospitals to serve those least mobile, operationalizing equity and potentially avoiding scenarios like those faced by Italy and Spain today.
Learn how to do this on PolicyMap now.
In addition to these health indicators we recently added ICU bed count data from Kaiser Health News to consider in relation to communities with severe COVID-19 risk factors.
Many cities are already bracing for oversized healthcare needs by repurposing convention centers and hotels as quarantine sites, and others may strategically site overflow facilities based on greatest anticipated need of the service areas. Departments of Health, local leadership and healthcare providers can use PolicyMap to inform resource allocation and additional needs for field hospitals, shelters and testing sites.