
Housing Choice Voucher Blog
NOTE: PolicyMap no longer publishes HVC data
We at PolicyMap are super excited to let our users know about an exciting new HUD dataset that is now available on PolicyMap: the Housing Choice Voucher (HCV) Housing Opportunity Index! In response to user requests, this timely indicator can now be found under the “Federal Guidelines” tab. The Index represents an area’s potential opportunity for HCV holders seeking housing and is intended for use by Public Housing Authorities (PHAs) who administer the HCV program.
HCV, a federal program through which HUD provides rent subsidy to eligible low-income families, is intended to provide geographic mobility to its participants and is one of the cornerstones of federal housing policy aiming to deconcentrate poverty. The program, however, has thus far proven limited in its ability to help low-income families move to areas of substantially greater opportunity. A vast body of research has determined that many HCV receivers have in fact moved to neighborhoods with above-average levels of poverty, thus creating new concentrations of poverty in new areas. Drawing upon this body of research, HUD has created the new HCV Housing Opportunity Index to identify areas that both provide a significant opportunity for voucher holders, but also will not be too negatively impacted by “small additions to the level of poverty” (HUD 2011).
To identify “opportunity” neighborhoods, HUD used base criteria defined by neighborhoods with 1) a level of poverty below 10%, and 2) a housing stock for which less than 4% of its current occupancy is by HCV households. For areas that met this base criterion, HUD conducted additional analysis to determine the amount of opportunity the neighborhood provides. This involved identifying a large number of variables measuring the area’s housing, demographic, and economic conditions and then narrowing them down through the use of factor analysis. Through this process, some of the conditions identified that would increase an area’s Opportunity Index Score included the existence of less than 5% unemployment, a minority population below 20%, and a workforce for which at least 75% have a short commute to work.
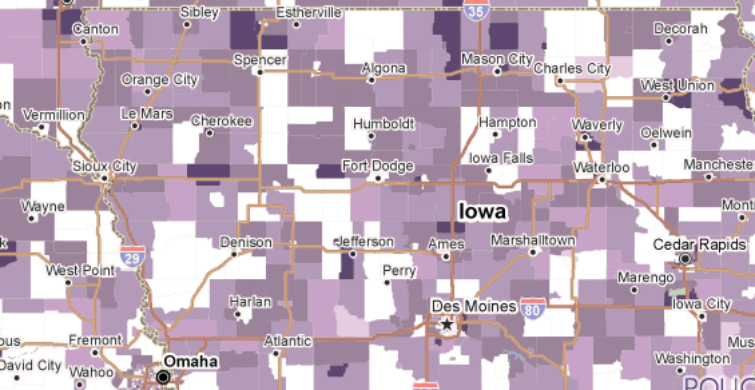
As seen in the map below, there are relatively few neighborhoods with moderate or high housing opportunities. The highest concentrations of such areas are in the Midwest and Great Lakes region.
According to HUD, approximately 40% of all tracts meet the minimum conditions to be considered an opportunity neighborhood (marked by a score of 40 or above). These tracts contain approximately 3.9 million units. HUD emphasizes that, given the varying levels of poverty that can exist within a census tract, inaccuracies can occur with tract-level analyses. Thus, users are recommended to use block group level data instead. To read more about the HCV Marketing Opportunity Index, read the PDF here.