
How to Conduct a Housing Needs Assessment Using PolicyMap: A Case Study in Indianapolis, IN

This article serves as a how-to guide for urban planners, public health leaders, nonprofit developers, community development officials, and affordable housing developers for conducting a comprehensive housing needs assessment using PolicyMap’s data layers. We’ll demonstrate how to use demographic, economic, housing, and lending indicators to evaluate housing adequacy, affordability, accessibility, quality, and community assets using our platform. PolicyMap is a nationwide online mapping and data platform housing 75,000+ research-ready indicators from both public and proprietary sources. Data covers topics such as demographics, income, housing, jobs, health, education, and more. For this assessment, we use Indianapolis, Indiana as our example geography.
Why Housing Needs Assessments Matter
A housing needs assessment evaluates whether housing stock meets current and future needs. In Indianapolis, growth pressures, an aging housing supply, and affordability challenges vary across neighborhoods. Indianapolis’s housing landscape presents a compelling case for a detailed needs assessment, particularly in the urban core, where affordability and housing quality are increasingly strained. Recent data from the Common Sense Institute shows that median home prices in the metro area surged by 83% since 2013—and by 53% since the onset of the COVID-19 pandemic which places homeownership further out of reach for middle-income households (Common Sense Institute, 2024). While suburbs experience robust growth and often offer newer, higher-quality housing stock, the older housing inventory remains susceptible to deterioration which underscores the need for strategic reinvestment and preservation (Indiana University Public Policy Institute, 2024; City of Carmel, 2023). Therefore, prioritizing Indianapolis’s urban neighborhoods in a housing needs assessment is essential to meet the needs of current and future residents. PolicyMap offers a single platform to integrate multiple datasets such as Moody’s Analytics housing gap analysis, HUD affordability data, HMDA lending patterns, our own Area Homeowner and Renter Affordability data and Census demographics into actionable insights and evaluate housing in Indianapolis, Indiana. Here is a list of key tenets that should be considered when producing a needs assessment:
Core Tenets
- Demographic Fit – Who lives here now? What are their income levels, household types, and trends?
- Housing Adequacy – Is there enough housing of the right size, cost, and type?
- Affordability – Are people spending more than they should on housing?
- Accessibility – Can residents obtain housing (e.g., mortgage access, credit)?
- Housing Quality – Is the existing stock safe, modern, and in good condition?
- Community Assets & Infrastructure – Are supportive resources available nearby?
- Strategic Planning – Where should investment or interventions start?
Demographics & Income Data
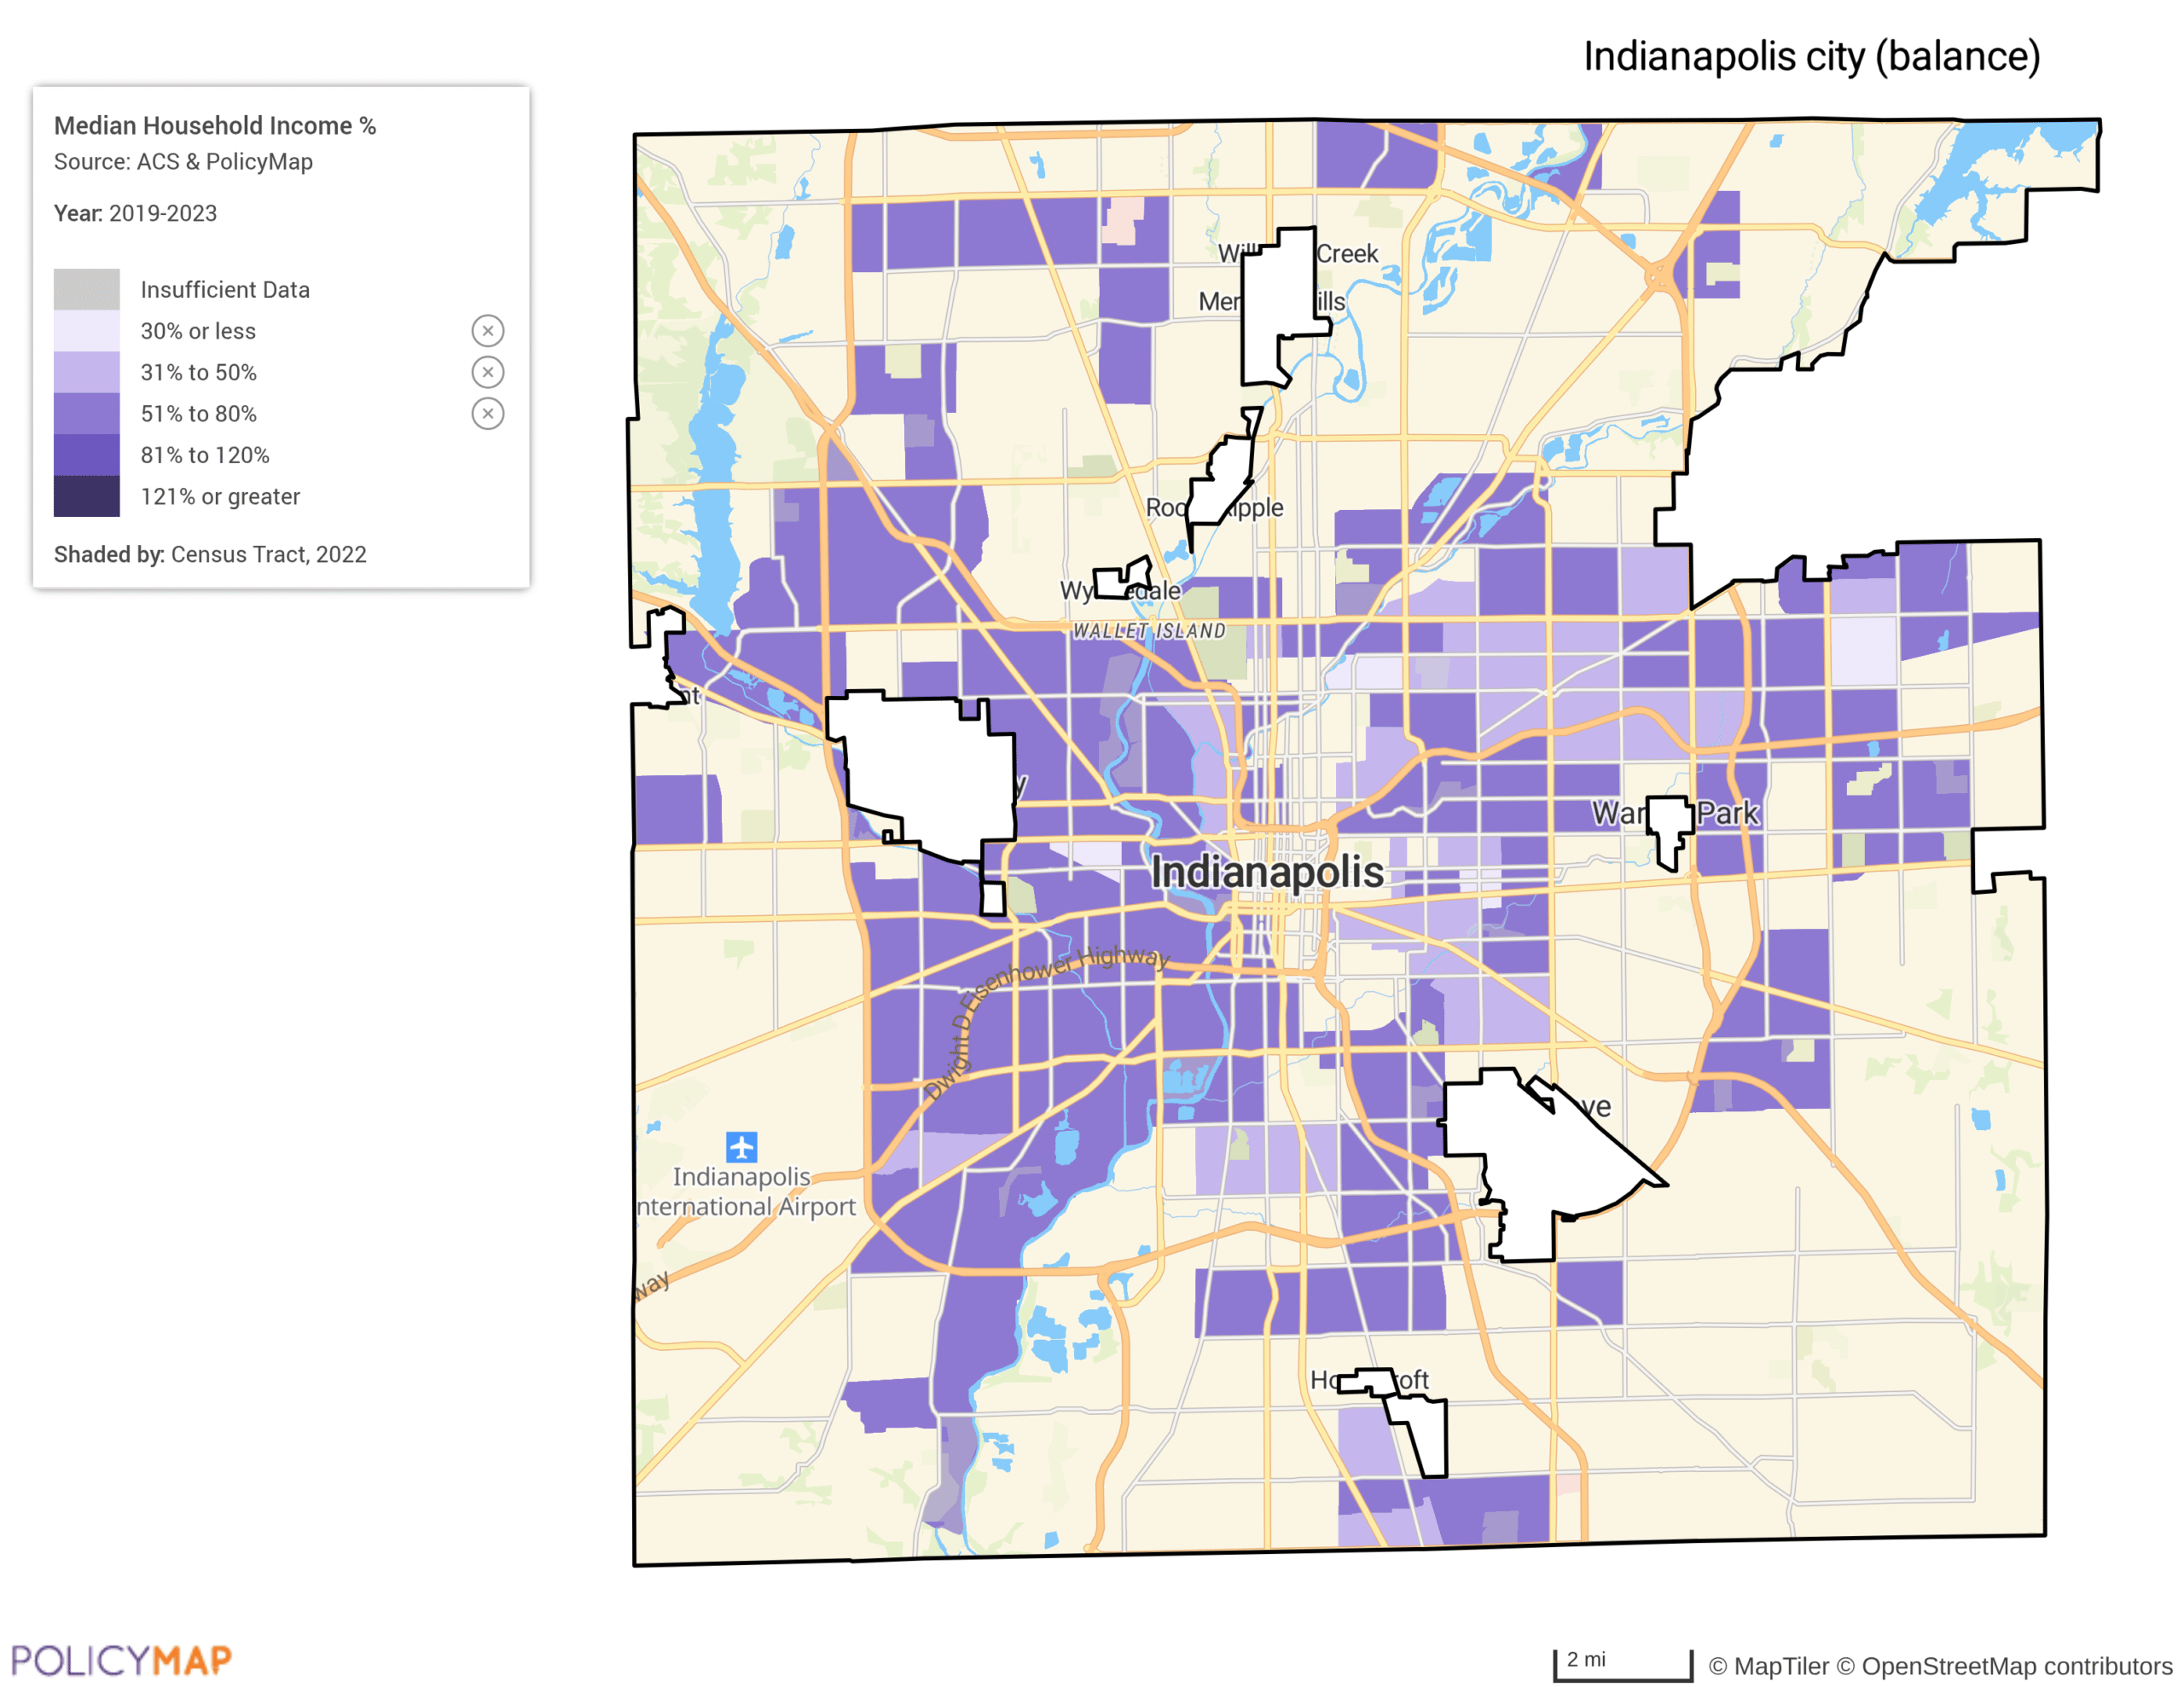
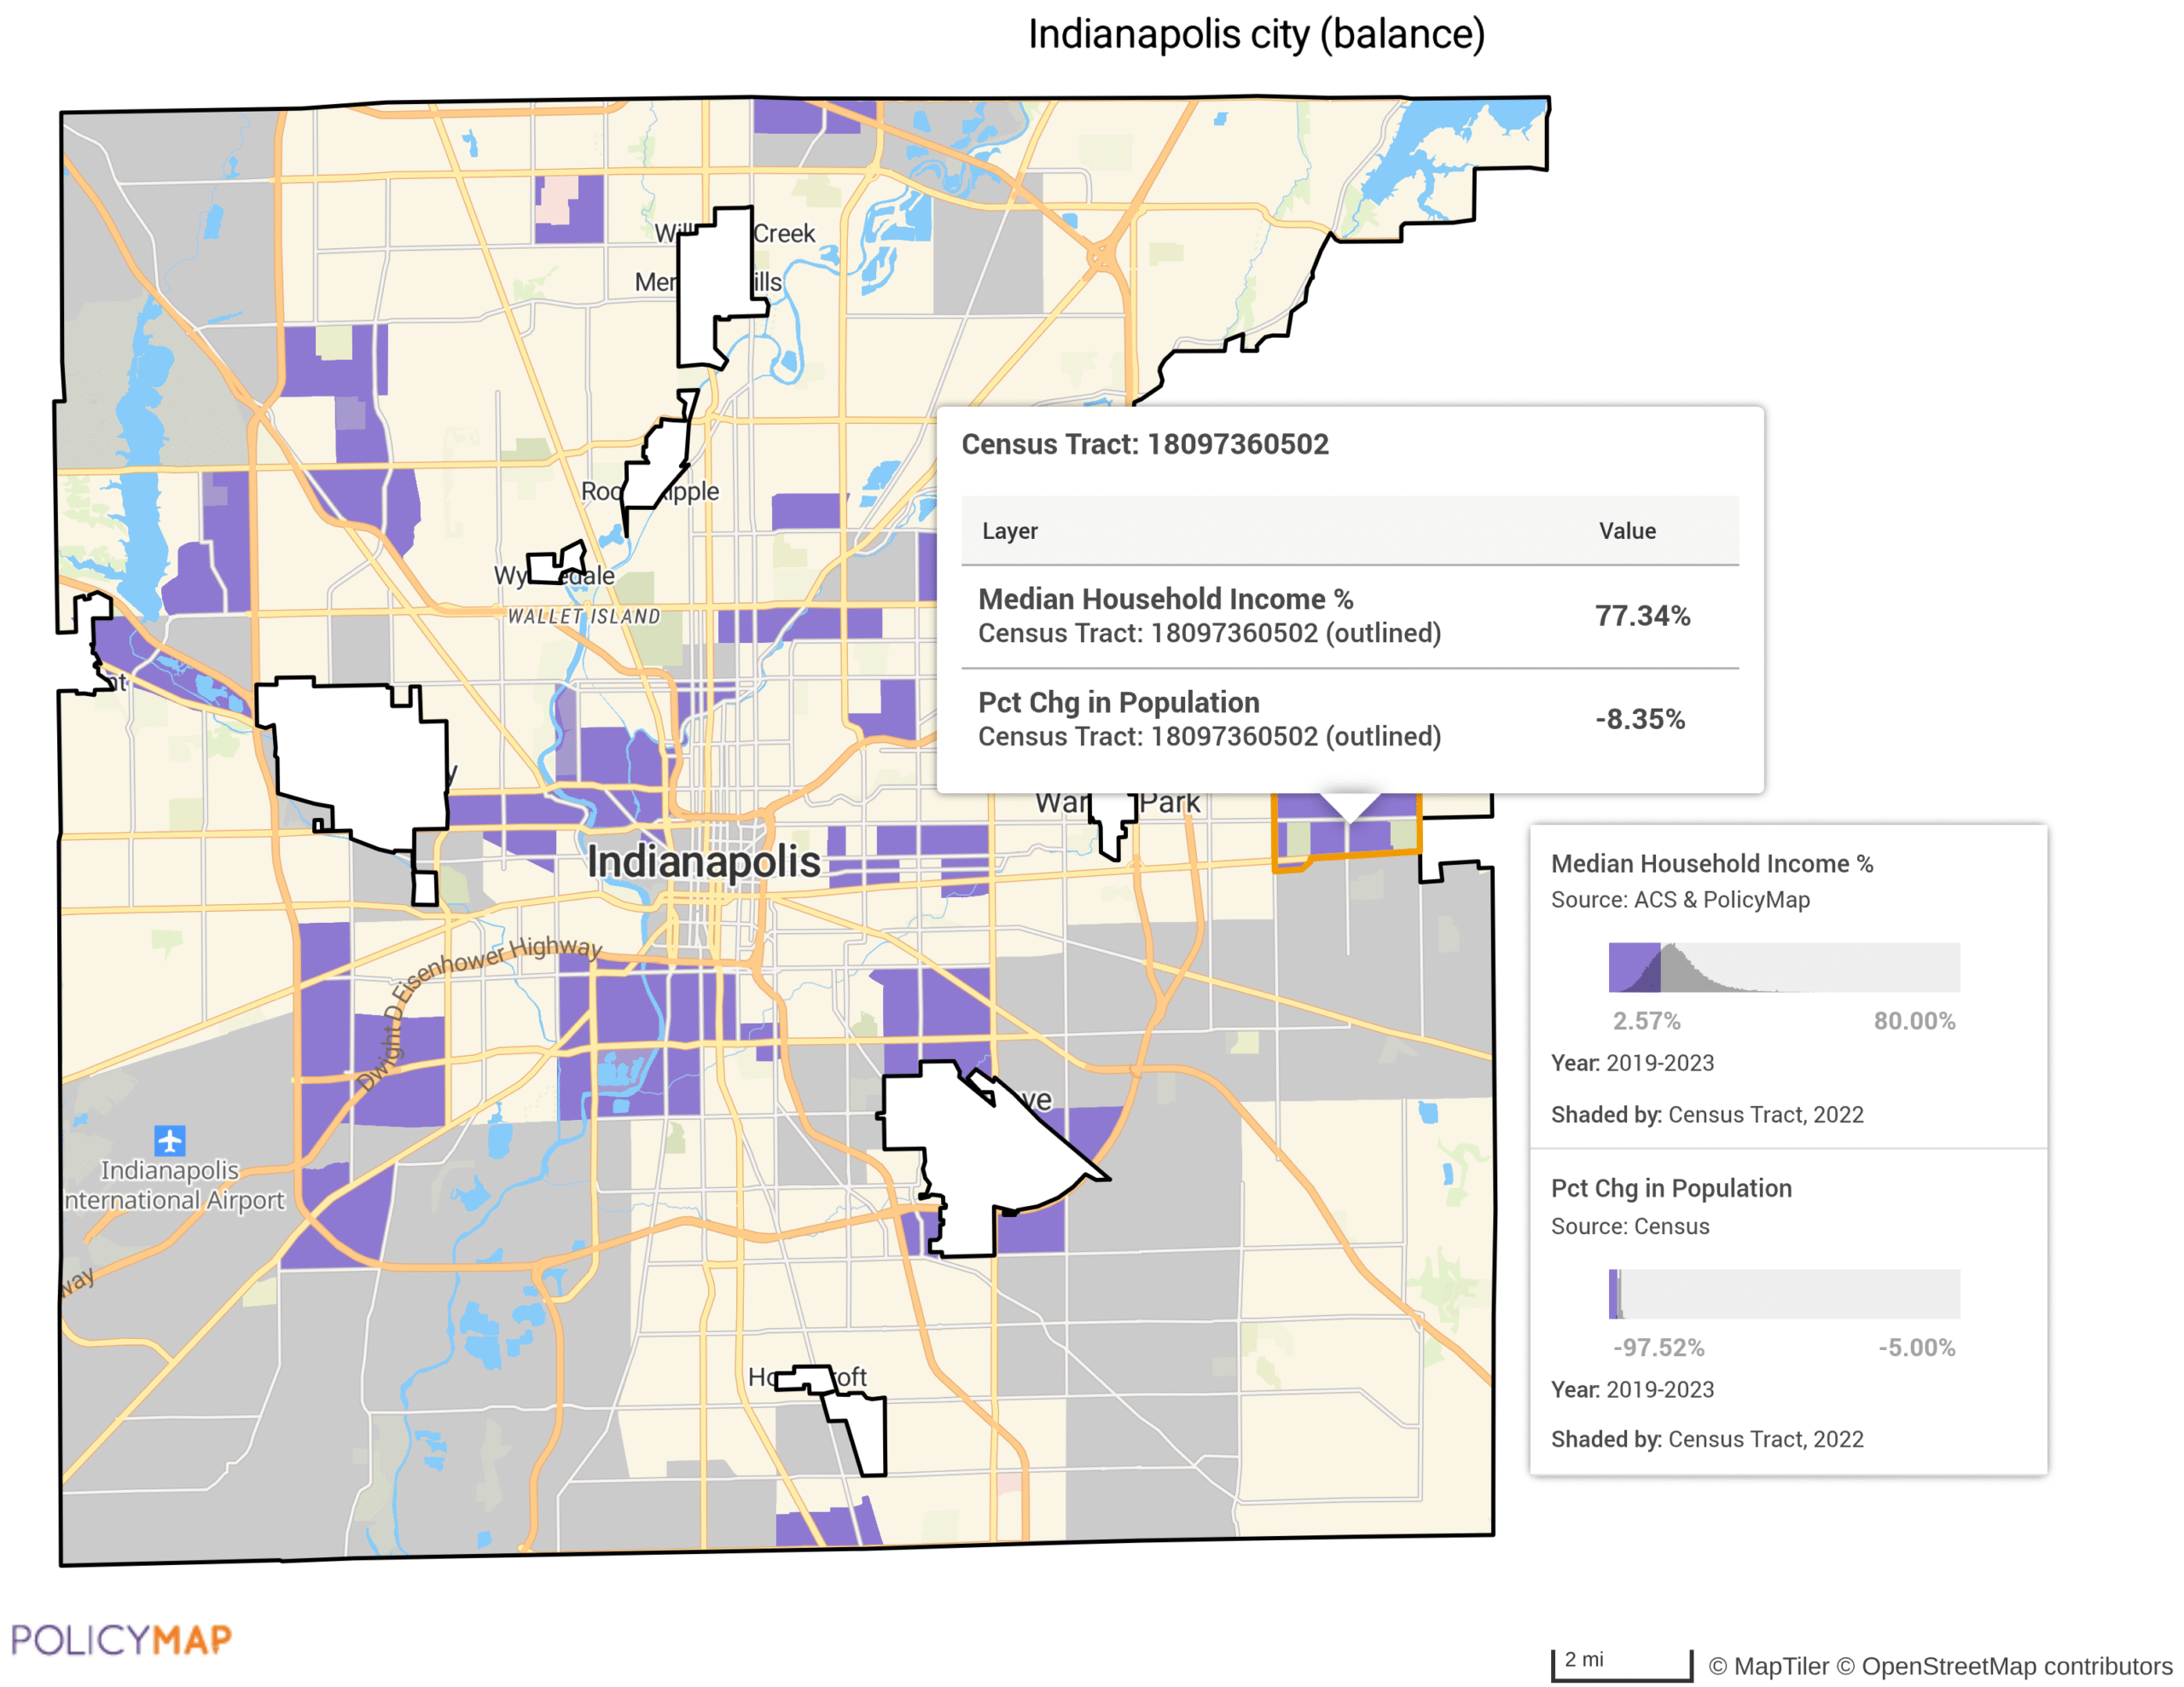
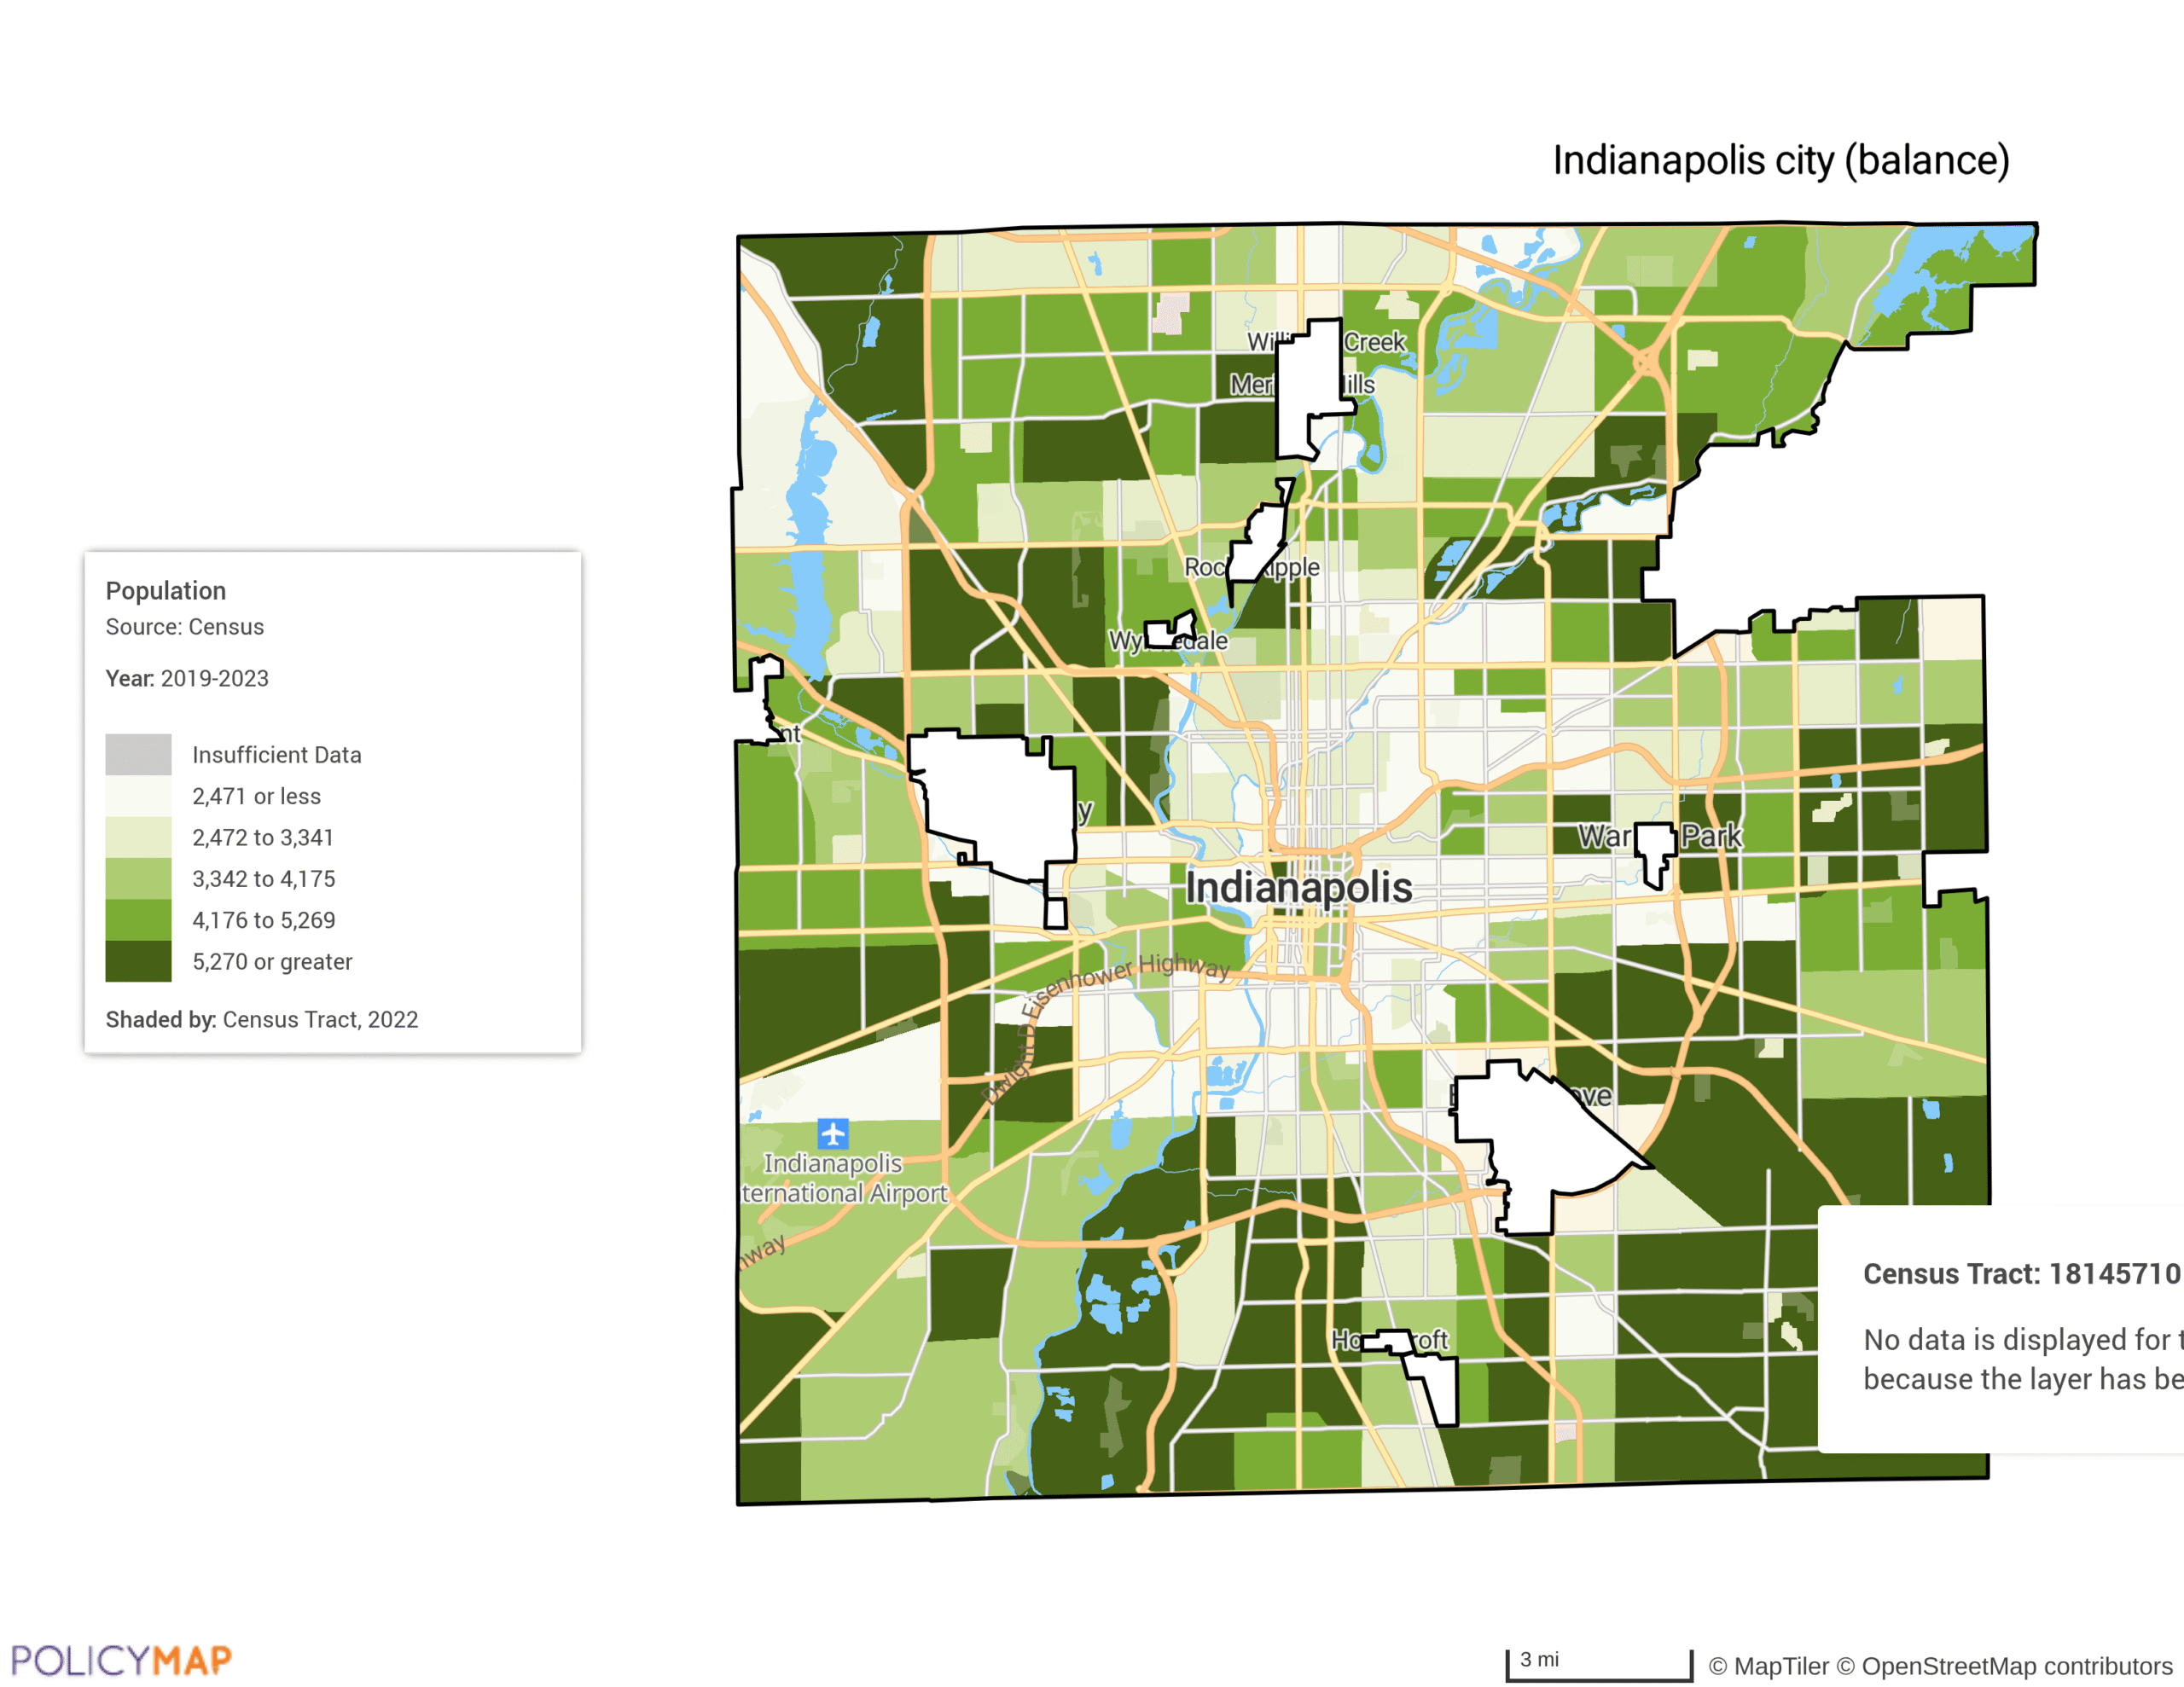
Indianapolis census tracts reveal a mix of incomes, with higher per capita income clusters in the northern suburbs and lower incomes in the urban core. Median household income maps show central areas often below 80% of Area Median Income (AMI), signaling a potential affordability strain. This is echoed by the 5-year percent change in households from 2014-2018 versus 2019-2023. Areas where the median household income is greater than 80% seem to have a higher rate of decline in households during the given time period. The affordability seems to be affecting higher income levels similarly to households below 80% AMI. Population data highlights higher density in the southern and eastern parts of the city. With fewer residents located in the central and northern parts of the city. The decline in already low-populated areas presents questions around affordability, sustainability, and the location of community assets.
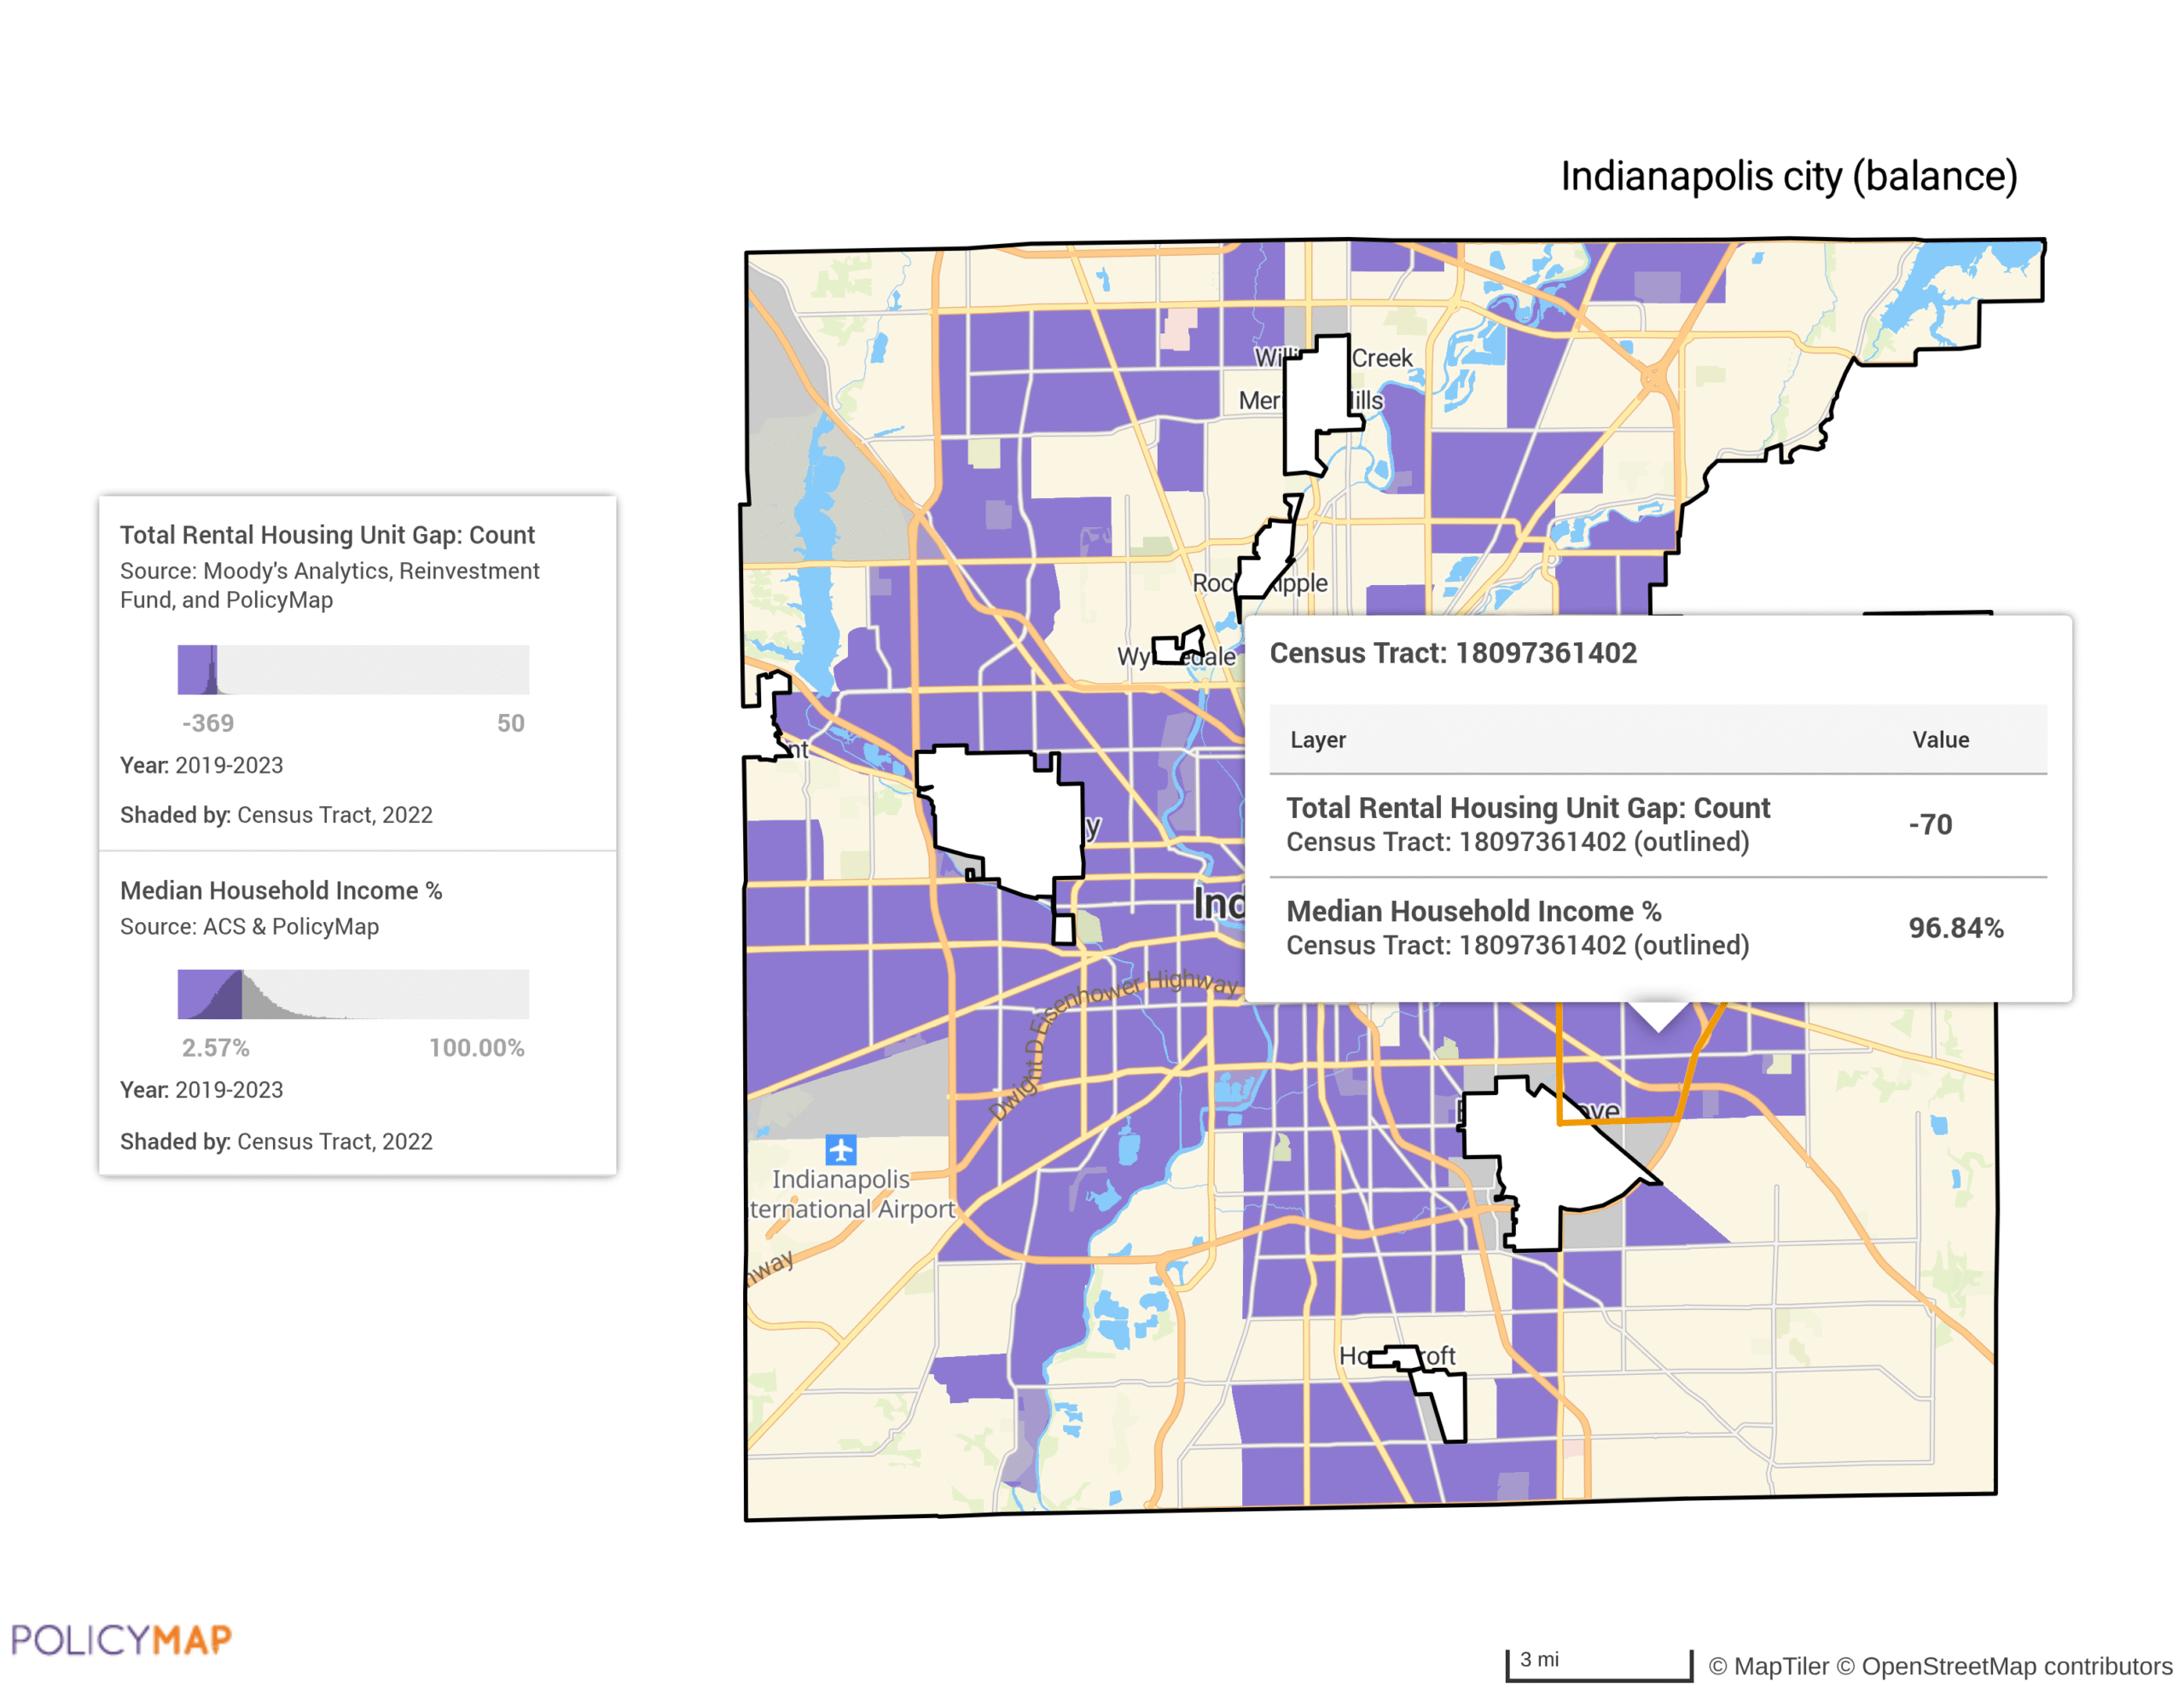
Housing Supply, Shortage & Affordability
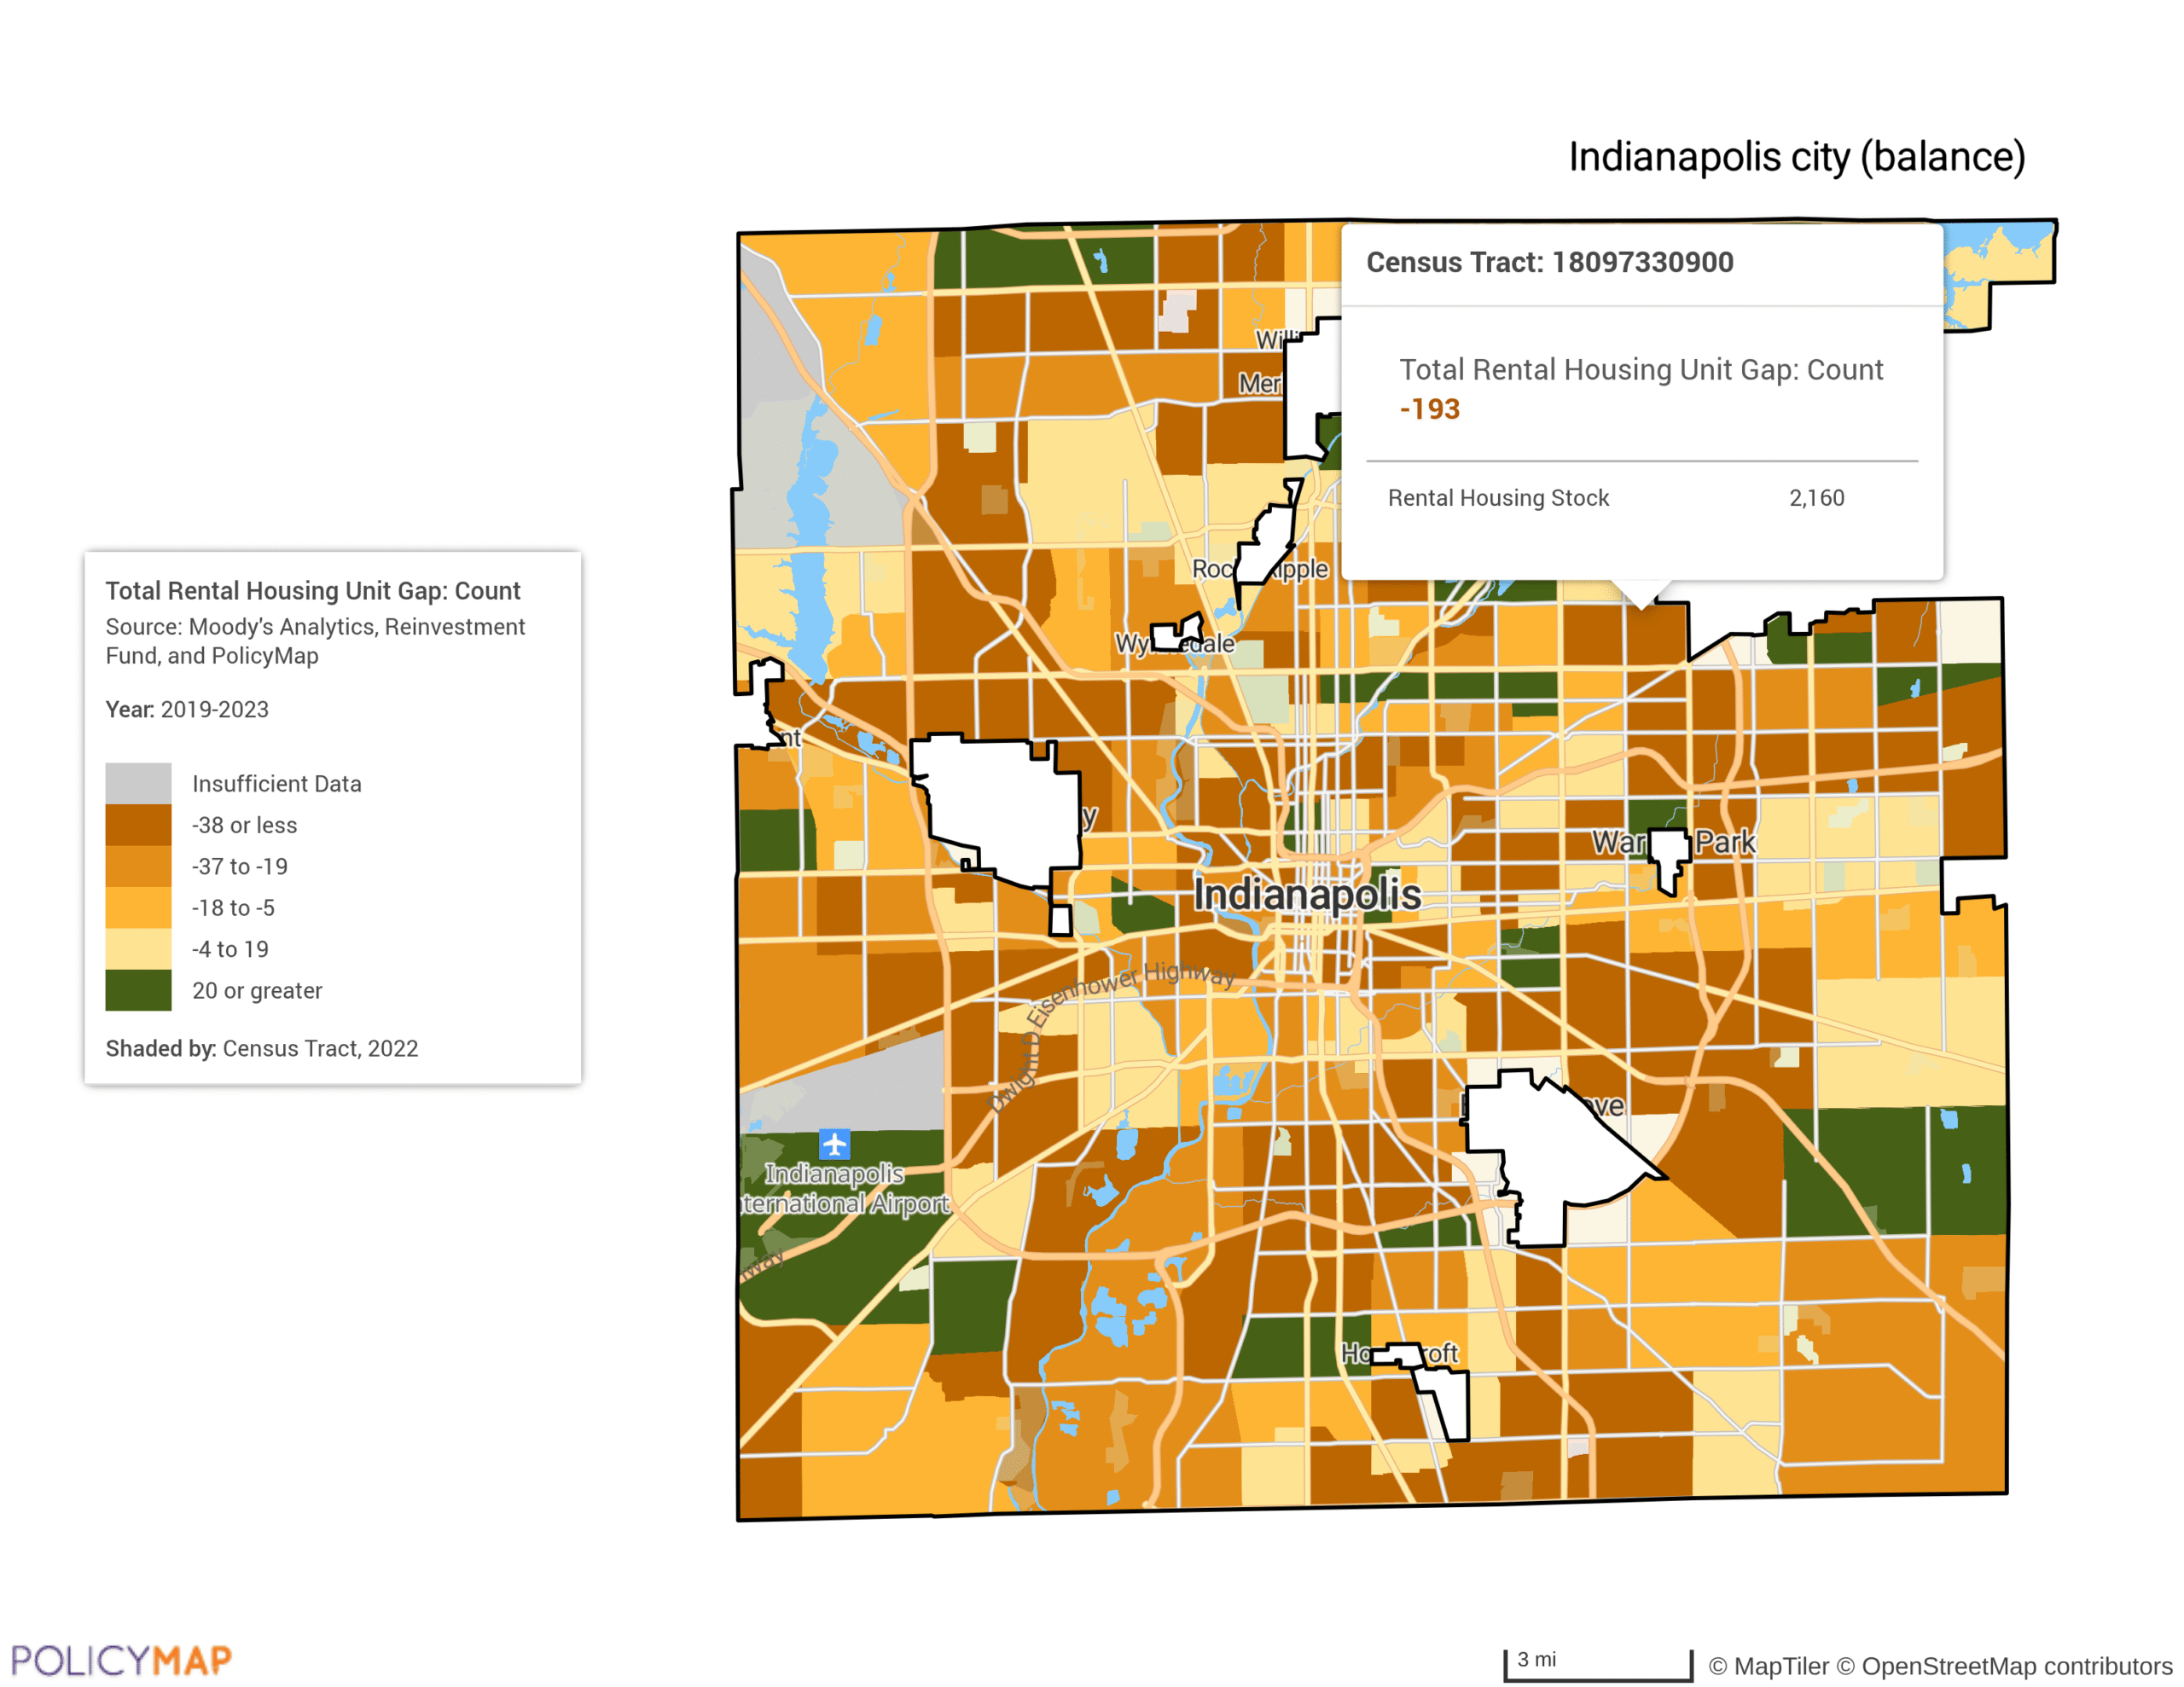
Moody’s Housing Gap data shows notable shortages across much of Indianapolis, especially in rental housing for moderate-income households. Some tracts show surpluses in higher-income suburban areas, while other tracts show shortages, notably in central and southeast city borders. The housing unit gap map indicates census tracts that reveal a broad undersupply of units in the majority of the city. Combining local income levels with the housing unit gap data helps to understand gaps in areas where people can afford to live. The south east presents as the area of great undersupply in total housing units, rental supply, and properties for homeowners. Housing officials can use these data to assess areas that are ripe for development.
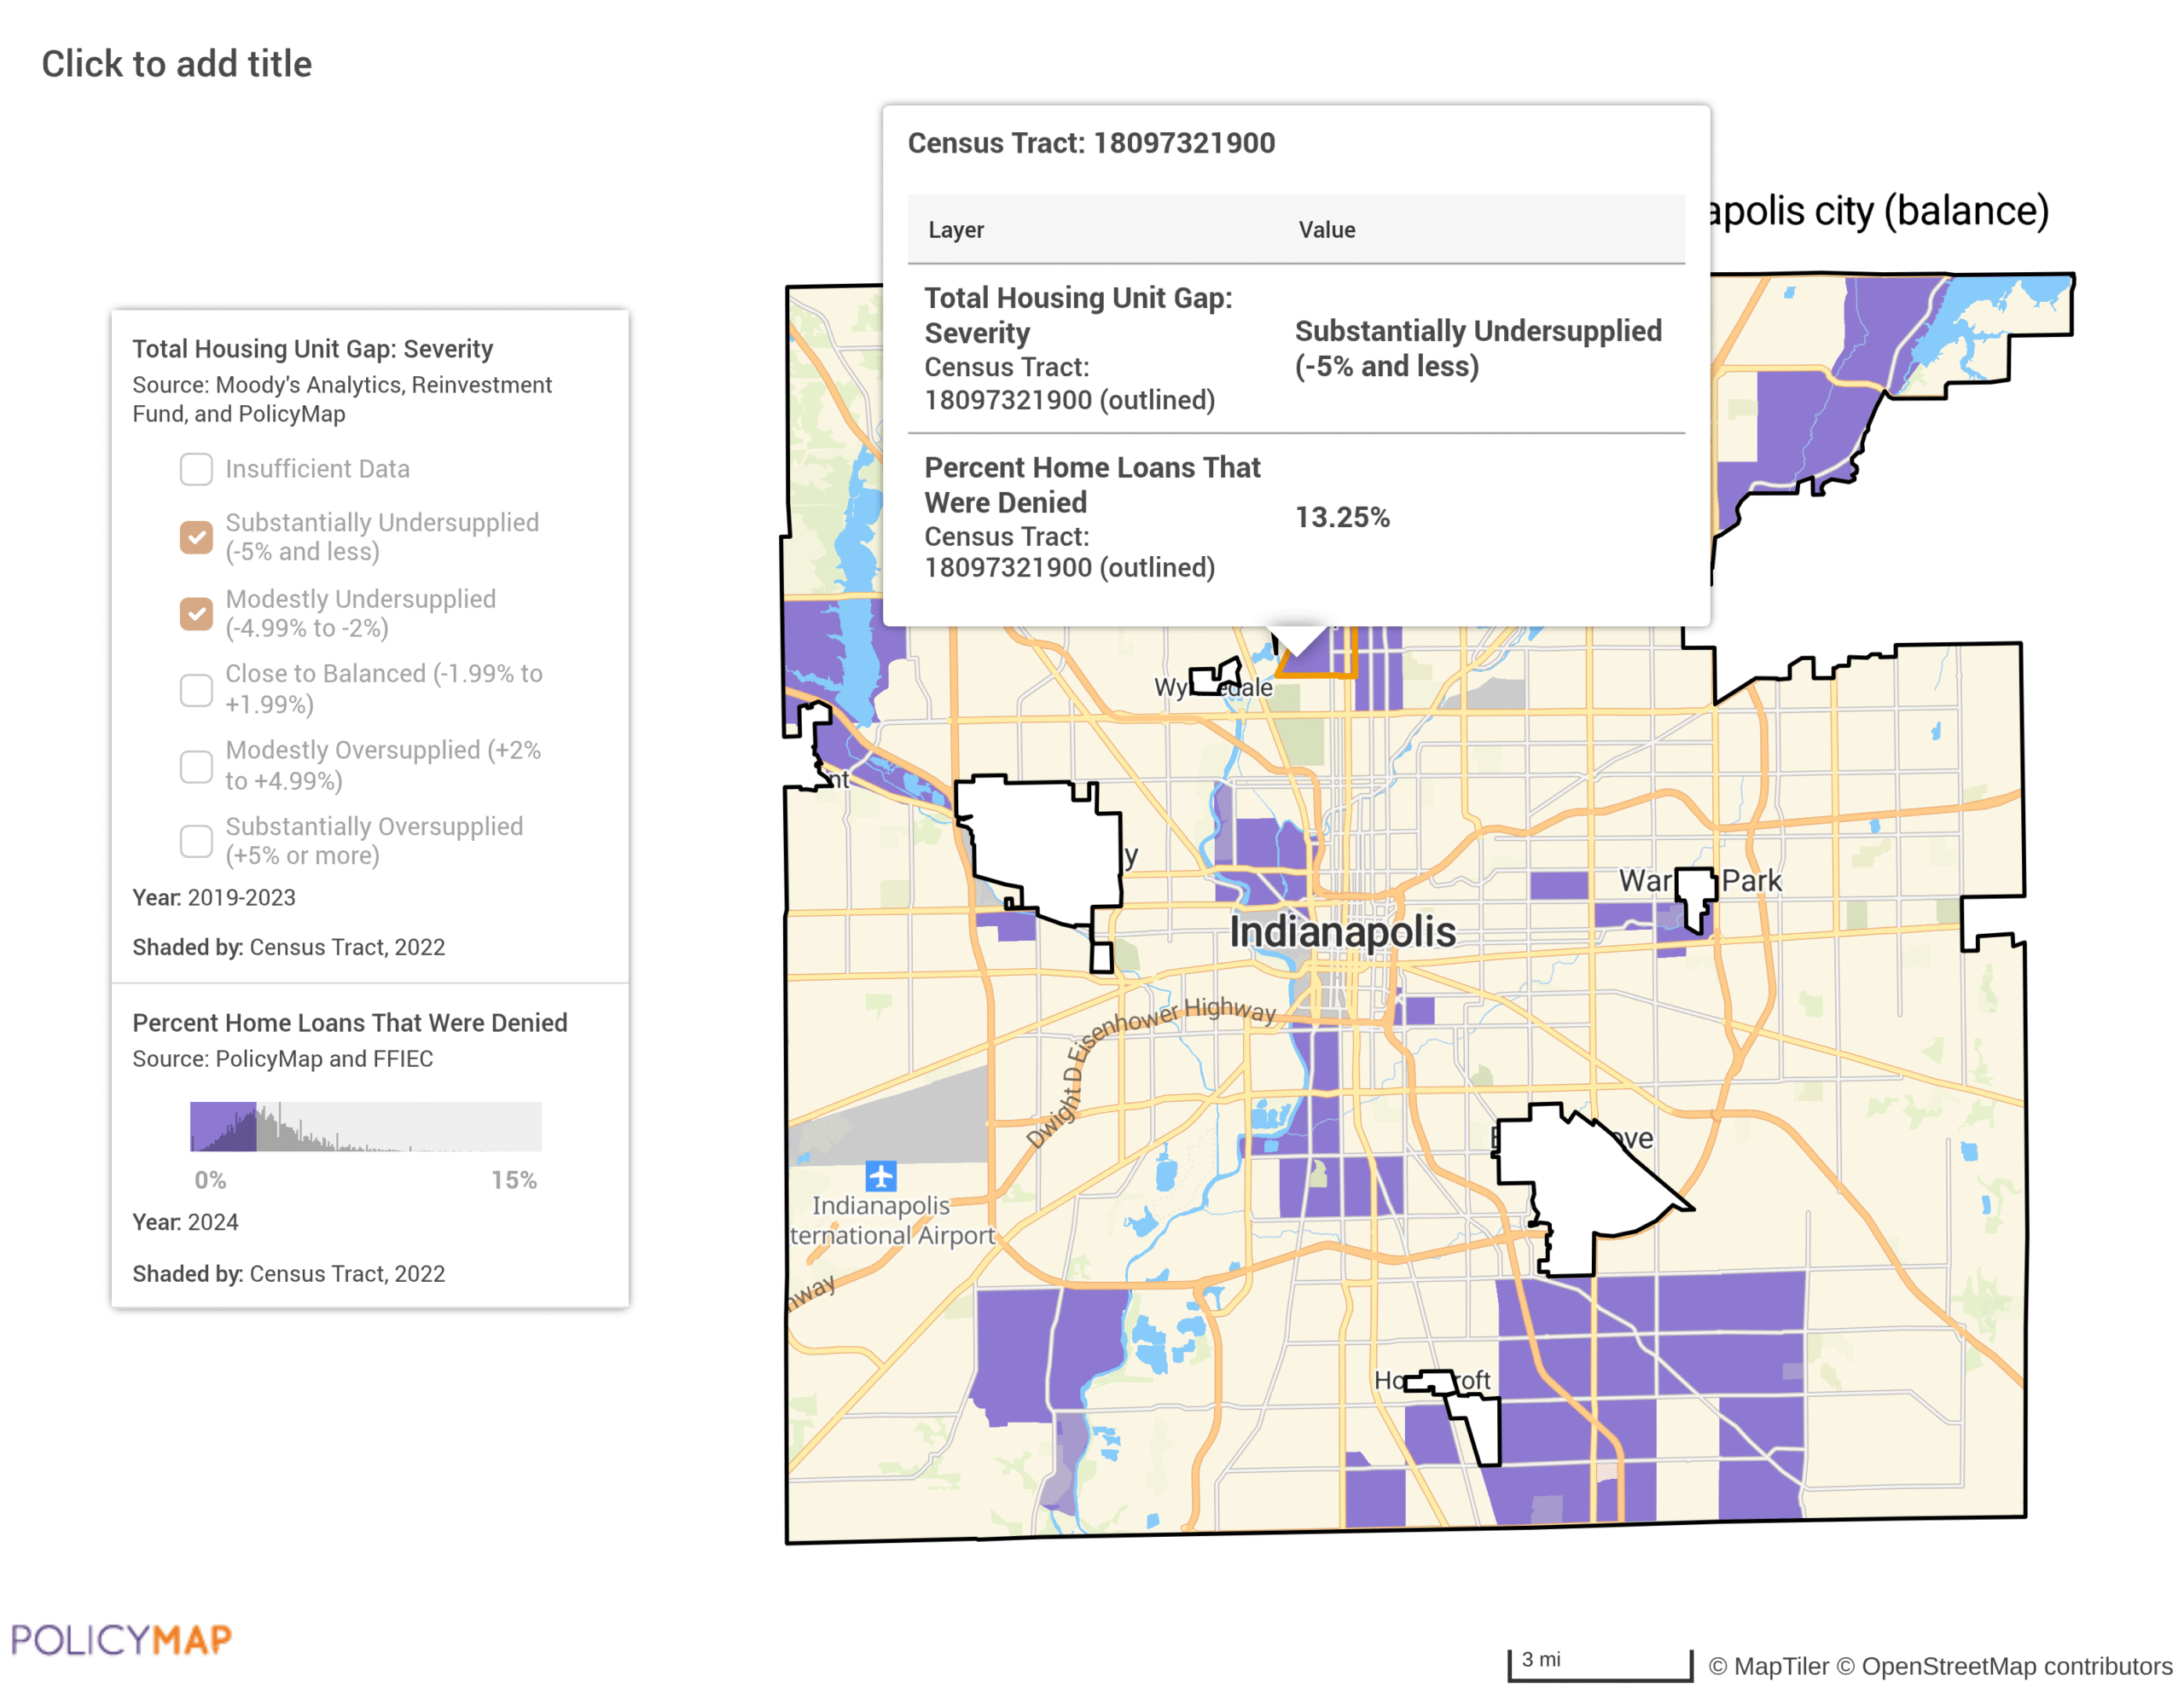
Assessing Housing Accessibility
HMDA mortgage denial data from 2024 shows denial rates above 10% in some southern and eastern tracts, suggesting barriers to homeownership beyond income constraints. What is interesting about these data is the similarities between mortgage denials areas over 15% and housing shortage areas identified using the Moody’s data on housing shortages. Areas with higher denial rates also have a moderately undersupplied to substantially undersupplied housing shortage. These areas may require targeted credit access programs or lending policy review as well as community partnership to provide affordable housing in target census tracts.
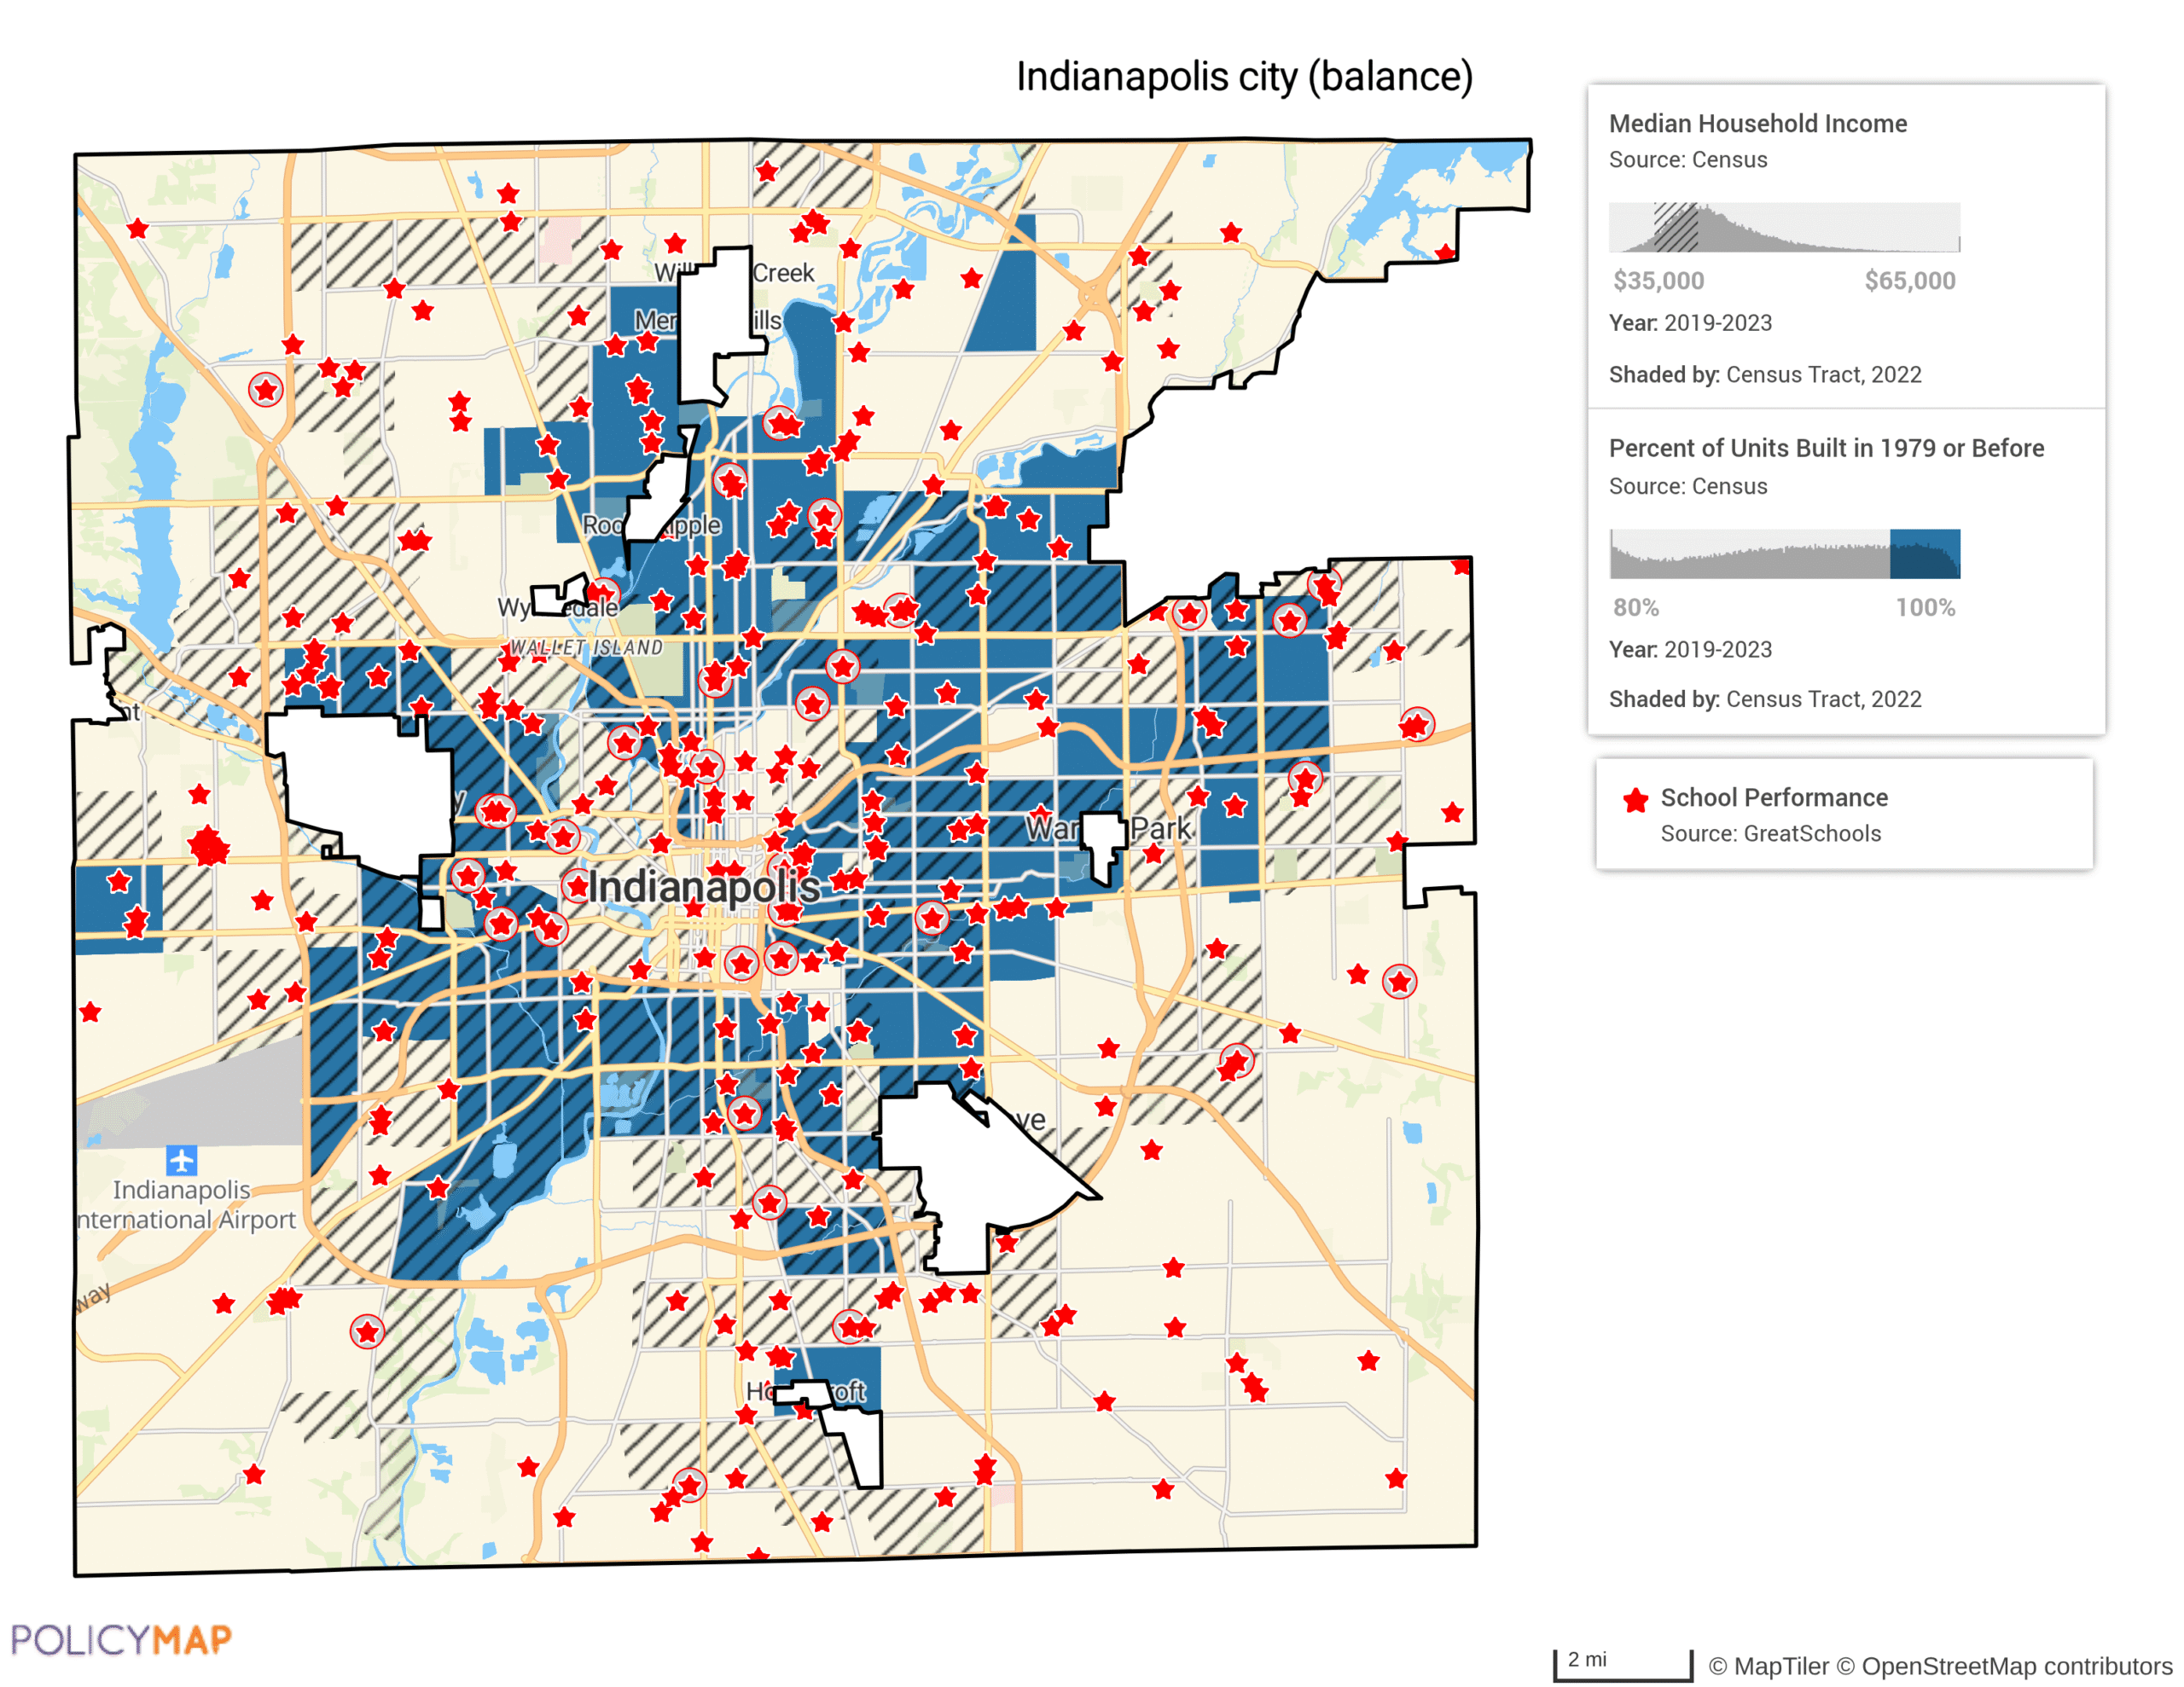
Housing Quality & Community Assets
Older housing stock dominates many neighborhoods, especially near downtown. While some areas enjoy strong school performance and access to jobs, others lack proximity to high-performing schools or transit access. Quality housing is most effective when paired with strong community assets such as high-performing schools, transit access, healthcare facilities, and job centers.
By combining demographics, supply, affordability, accessibility, and asset mapping, Indianapolis stakeholders can pinpoint priority tracts for investment. For example, tracts with low AMI, high cost burden, housing shortages, and poor access to quality schools could be targeted for both new construction and infrastructure improvements. PolicyMap allows you to integrate dozens of datasets into one interactive map, enabling smarter, data-driven housing strategies. It transforms complex data into clear, actionable strategies. By using these tools, local governments, developers, and nonprofits can align investments with actual community needs and ensure that housing policy decisions are backed by solid evidence.
Start Your Own Housing Needs Assessment with PolicyMap
Ready to uncover housing gaps and guide smarter investments in your community? Connect with our team to learn how PolicyMap can support your planning, development, or policy goals with powerful, location-based data.