
How the Debt Ceiling Affects Your Neighborhood
The big news recently has been the dispute in Washington about raising the debt ceiling. The debate has centered around two issues: how much to cut entitlement spending, and how much to raise taxes. Depending where you are, either of these factors could have effects on your community, and PolicyMap can help you see how.
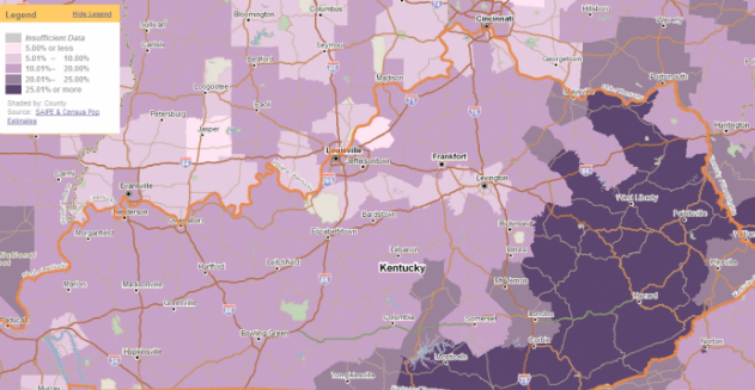
In terms of federal entitlement spending, PolicyMap has a few indicators that show how much is going to different areas. Supplemental Security Income (SSI) is one program that financially aids low-income people who are age 65 or older, blind, or disabled. On PolicyMap, you can see both how many and what percentage of people in different counties receive SSI. In 2009, seven of the top ten counties that received SSI, in terms of percentage of the population, were in Kentucky, led by Owsley County.

Owsley County also leads the nation in percent of the population that received Food Stamps through the Supplemental Nutrition Assistance Program (SNAP), at 51.1% in 2008.

Another good indicator you may want to check out to measure entitlement spending is redemptions in the Women, Infants, and Children (WIC) program.
On the revenue side of the budget debate, we have the most direct source there is: the IRS. We have data on taxes paid, and who’s paying those taxes, so if taxes are indeed raised, you can see whether people in your area will be affected.
In the tax revenue debate, discussion has centered around raising rates on the highest marginal income levels. Using IRS data analyzed by the Brookings Institution available on PolicyMap, we can see how many taxpayers in a given area have annual incomes above $100,000. Looking at percentages, the counties with the highest concentrations of wealth are suburbs like Hunterdon County, New Jersey; Falls Church City, Virginia; Howard, Maryland; and Marin, California. However, if you look at the total number of high-income taxpayers, the number one county is Los Angeles. Why is this interesting? It’s also the county receiving the most benefits through the WIC program.
There’s one other set of indicators on PolicyMap that are interesting to look at regarding the debt-ceiling debate: Congressional election data. And it shows that both parties may have a lot to lose in this debate. Los Alamos County, New Mexico, has the highest concentration of high-income taxpayers. It also is part of New Mexico’s Third District, where Democrat Ben Ray Lujan received 57% of the vote in 2010. In Kentucky’s Fifth District, where Owsley County sits, Republican Harold Rogers won overwhelmingly last election.
![]()