
Impact of New Markets Tax Credits with data from the CDFI Fund
Many of our subscribers are familiar with PolicyMap’s New Markets eligibility data, which is one of the easiest ways to find areas that qualify for this competitive program. With newly updated New Markets projects data (located at the bottom of the Federal Guidelines tab,) anyone interested in New Markets tax credits can also see the impact of the program at the state, zip, and census tract levels.
The New Markets Tax Credit is a federal incentive designed to spur investment in low-income communities. The program, which went into effect in 2002, has awarded over 35 billion dollars of investing power nationwide to organizations that serve and remain accountable to low-income communities and/or persons –certified Community Development Entities (CDEs). CDEs, which are often affiliated with banks or CDFIs, draw equity investments from investors and disperse those funds through real estate and business transactions to businesses that qualify to receive them. The amount of equity raised is determined by the NMTC allocation. NMTC Projects also include leveraged, non-QLICI funds that account for a large percentage of total project costs. There are a lot of acronyms used in reference to the NMTC process; here is a quick vocabulary lesson:
- CDE:
Community Development Entity certified by the CDFI Fund - QEI:
Qualified Equity Investments: NMTC Allocation allows the CDE to raise a certain dollar amount from investors in exchange for tax credits. - QLICI:
The CDE uses the funds from QEIs to make Qualifying Low Income Community Investments. These can be capital investments, loans, or transfers to other CDEs. - QALICB:
Qualified Low-Income Community Businesses operating in low-income communities are eligible to receive the QLICI.

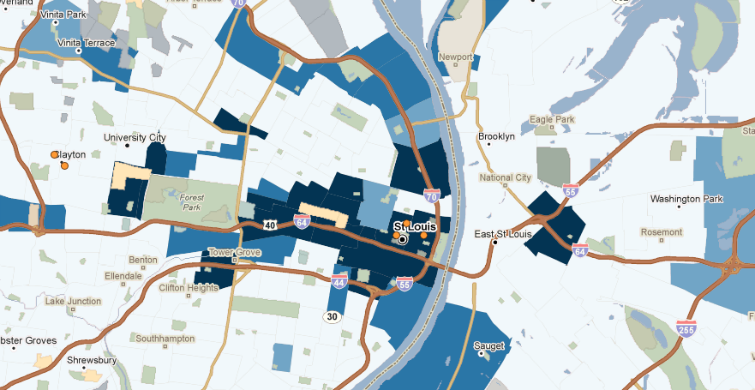
We have also included the locations of Community Development Entities with New Markets transactions since FY 2003 with this update. These points include the details of their projects, QLICI transactions , and partnering CDEs. Find them under Add Sites > Banking and Lending. For example, the City of St. Louis, Missouri has received some of the largest allocations of New Markets dollars throughout the life of the program, through the St. Louis Development Corporation CDE.
The map below shows the tracts around the Gateway Arch where investments have been highly concentrated since 2003:
Because project data for New Markets Tax Credits is now available for census tracts, it is easy to compare it with eligibility criteria using the Analytics feature. The shaded areas on the map below are those that qualify for the New Markets program but have not received any QLICI investments during fiscal years 2003 through 2011. This analytic shows that there is potential to expand the New Markets program into neighborhoods outside the immediate downtown area:
